How to Use Tracing to Analyze Your Applications
The team has been hard at work focusing on Observability and what it really means for developers, SREs, DevOps teams or whatever method currently used within your organization. We have written a few articles along these lines and you can find links to them below.
This article by Bill Shetti and Shrivatsa Updahye focuses on the use cases for Tracing and how to emplement in a variety of development languages.
This article by Me details the setting up of Wavefront to utilize the metrics and logging that Jaeger Tracing provides.
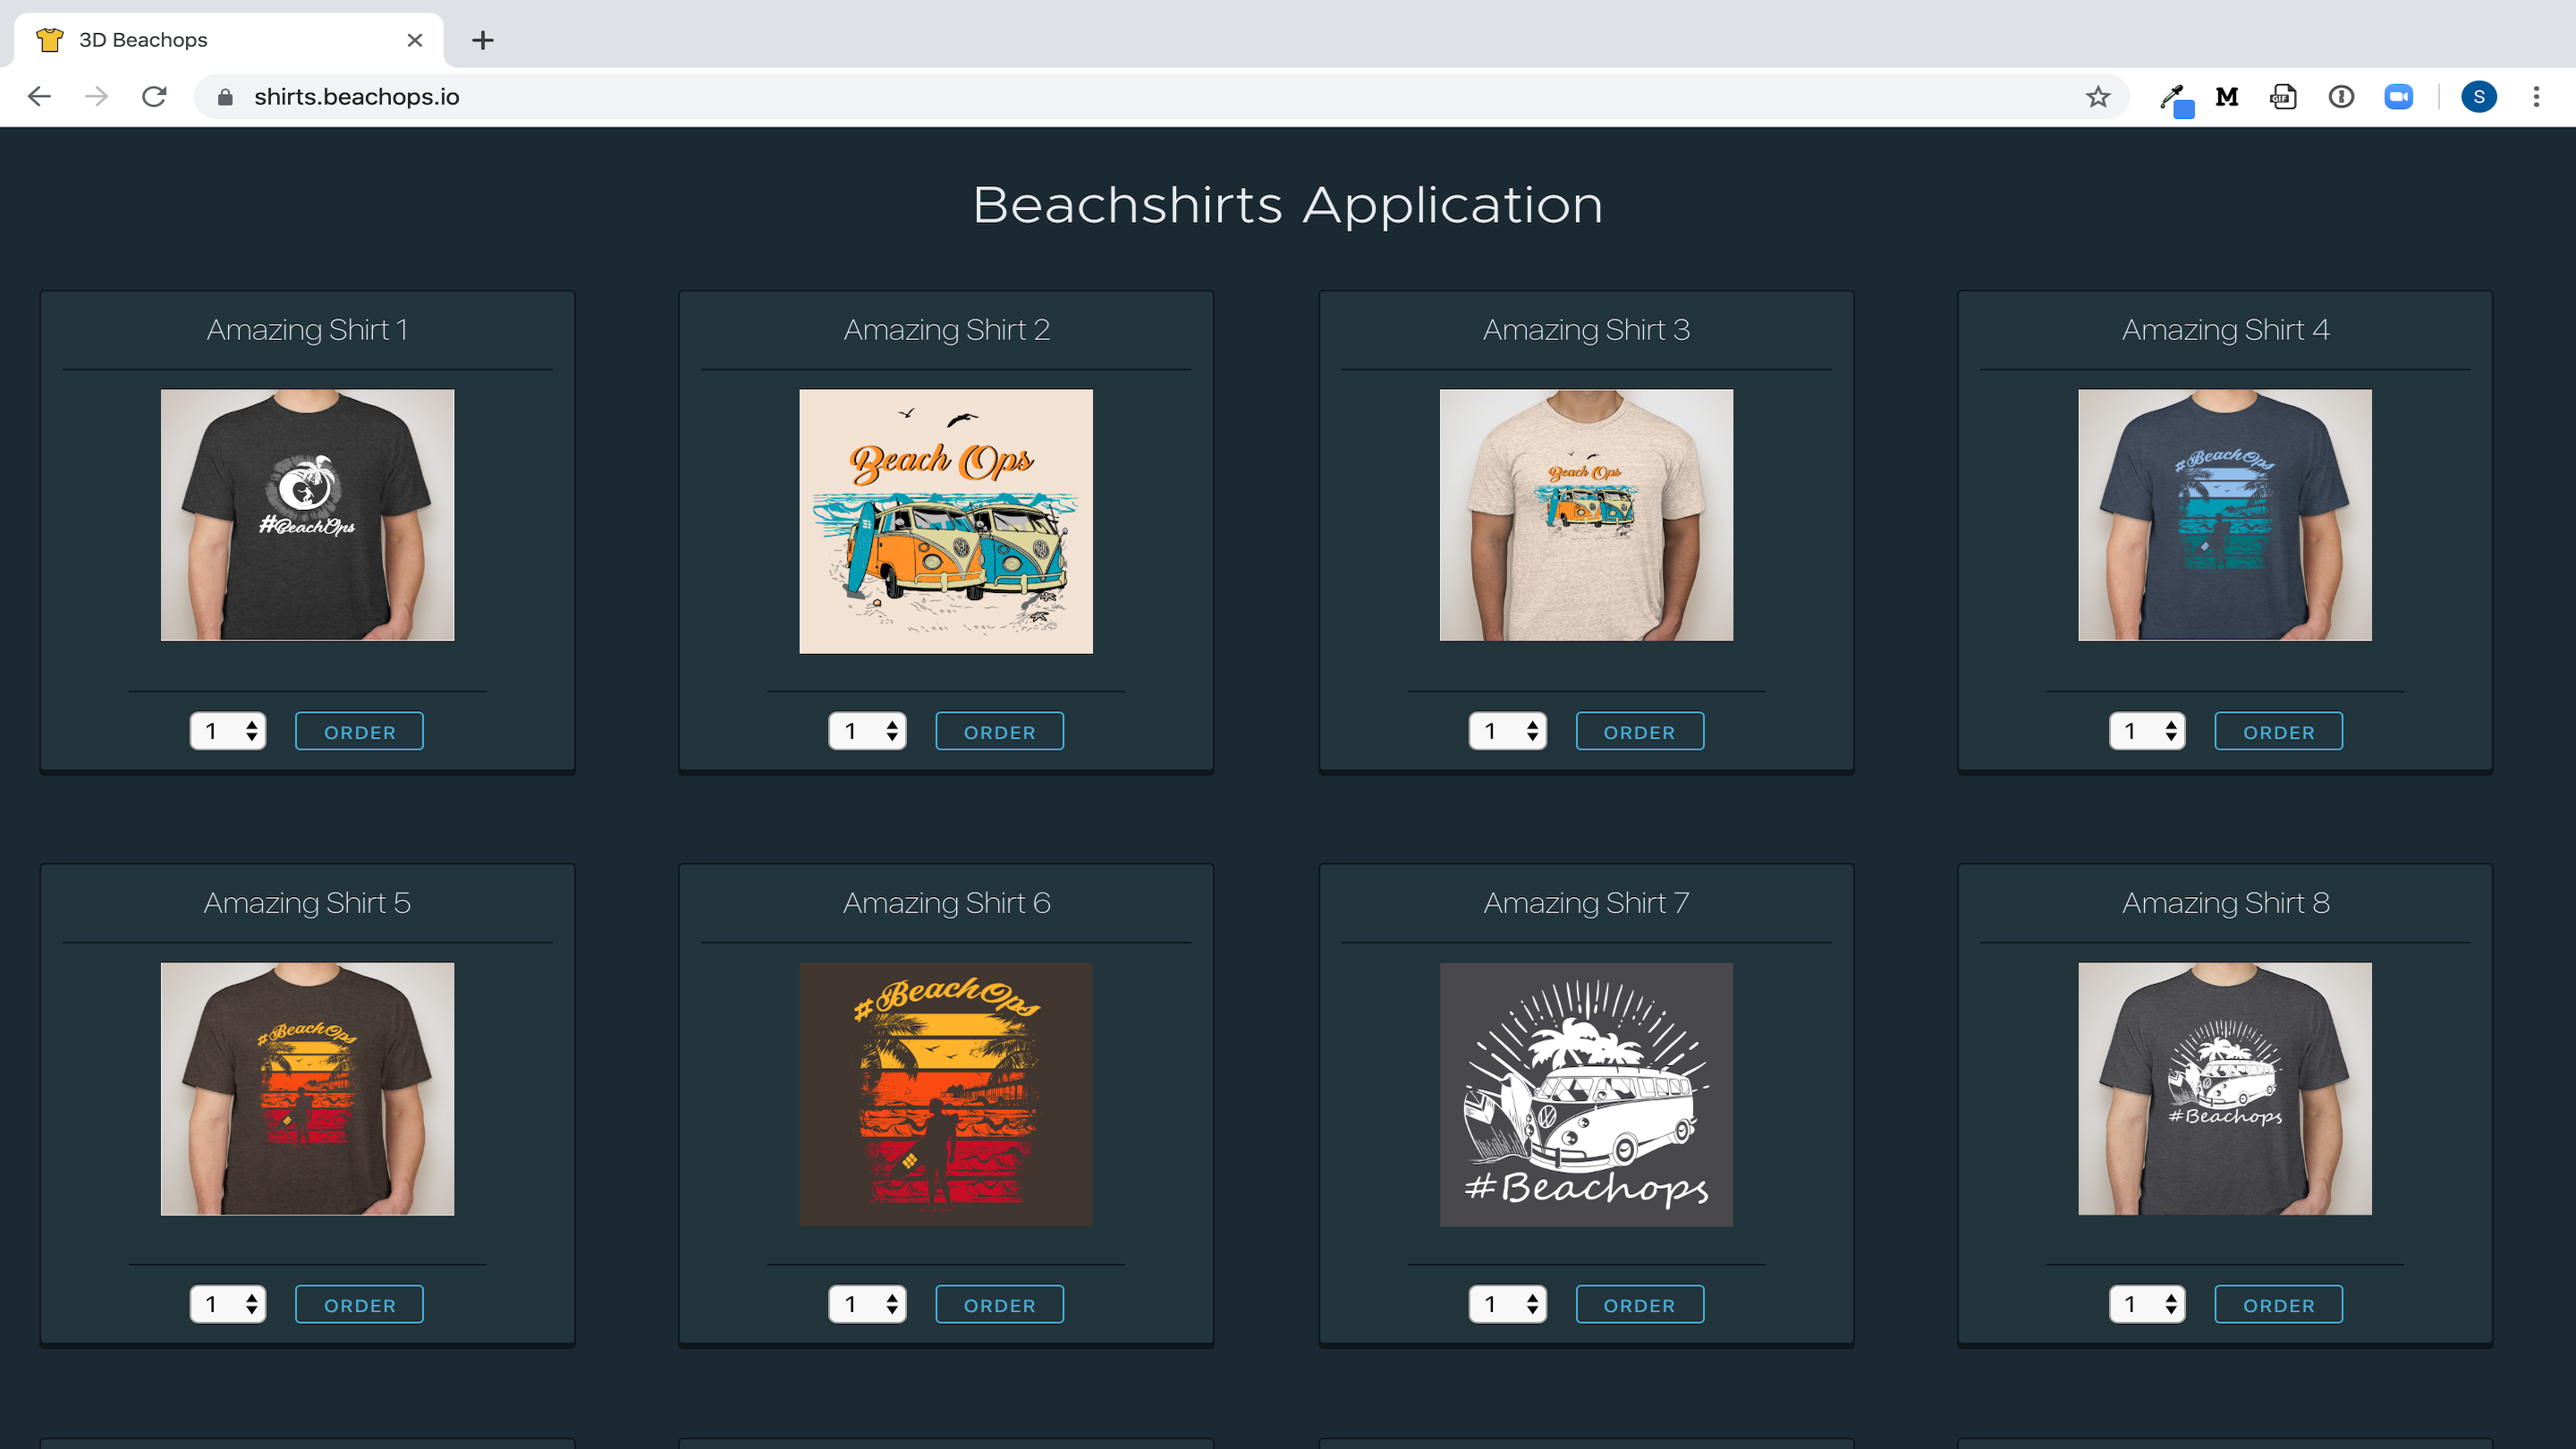
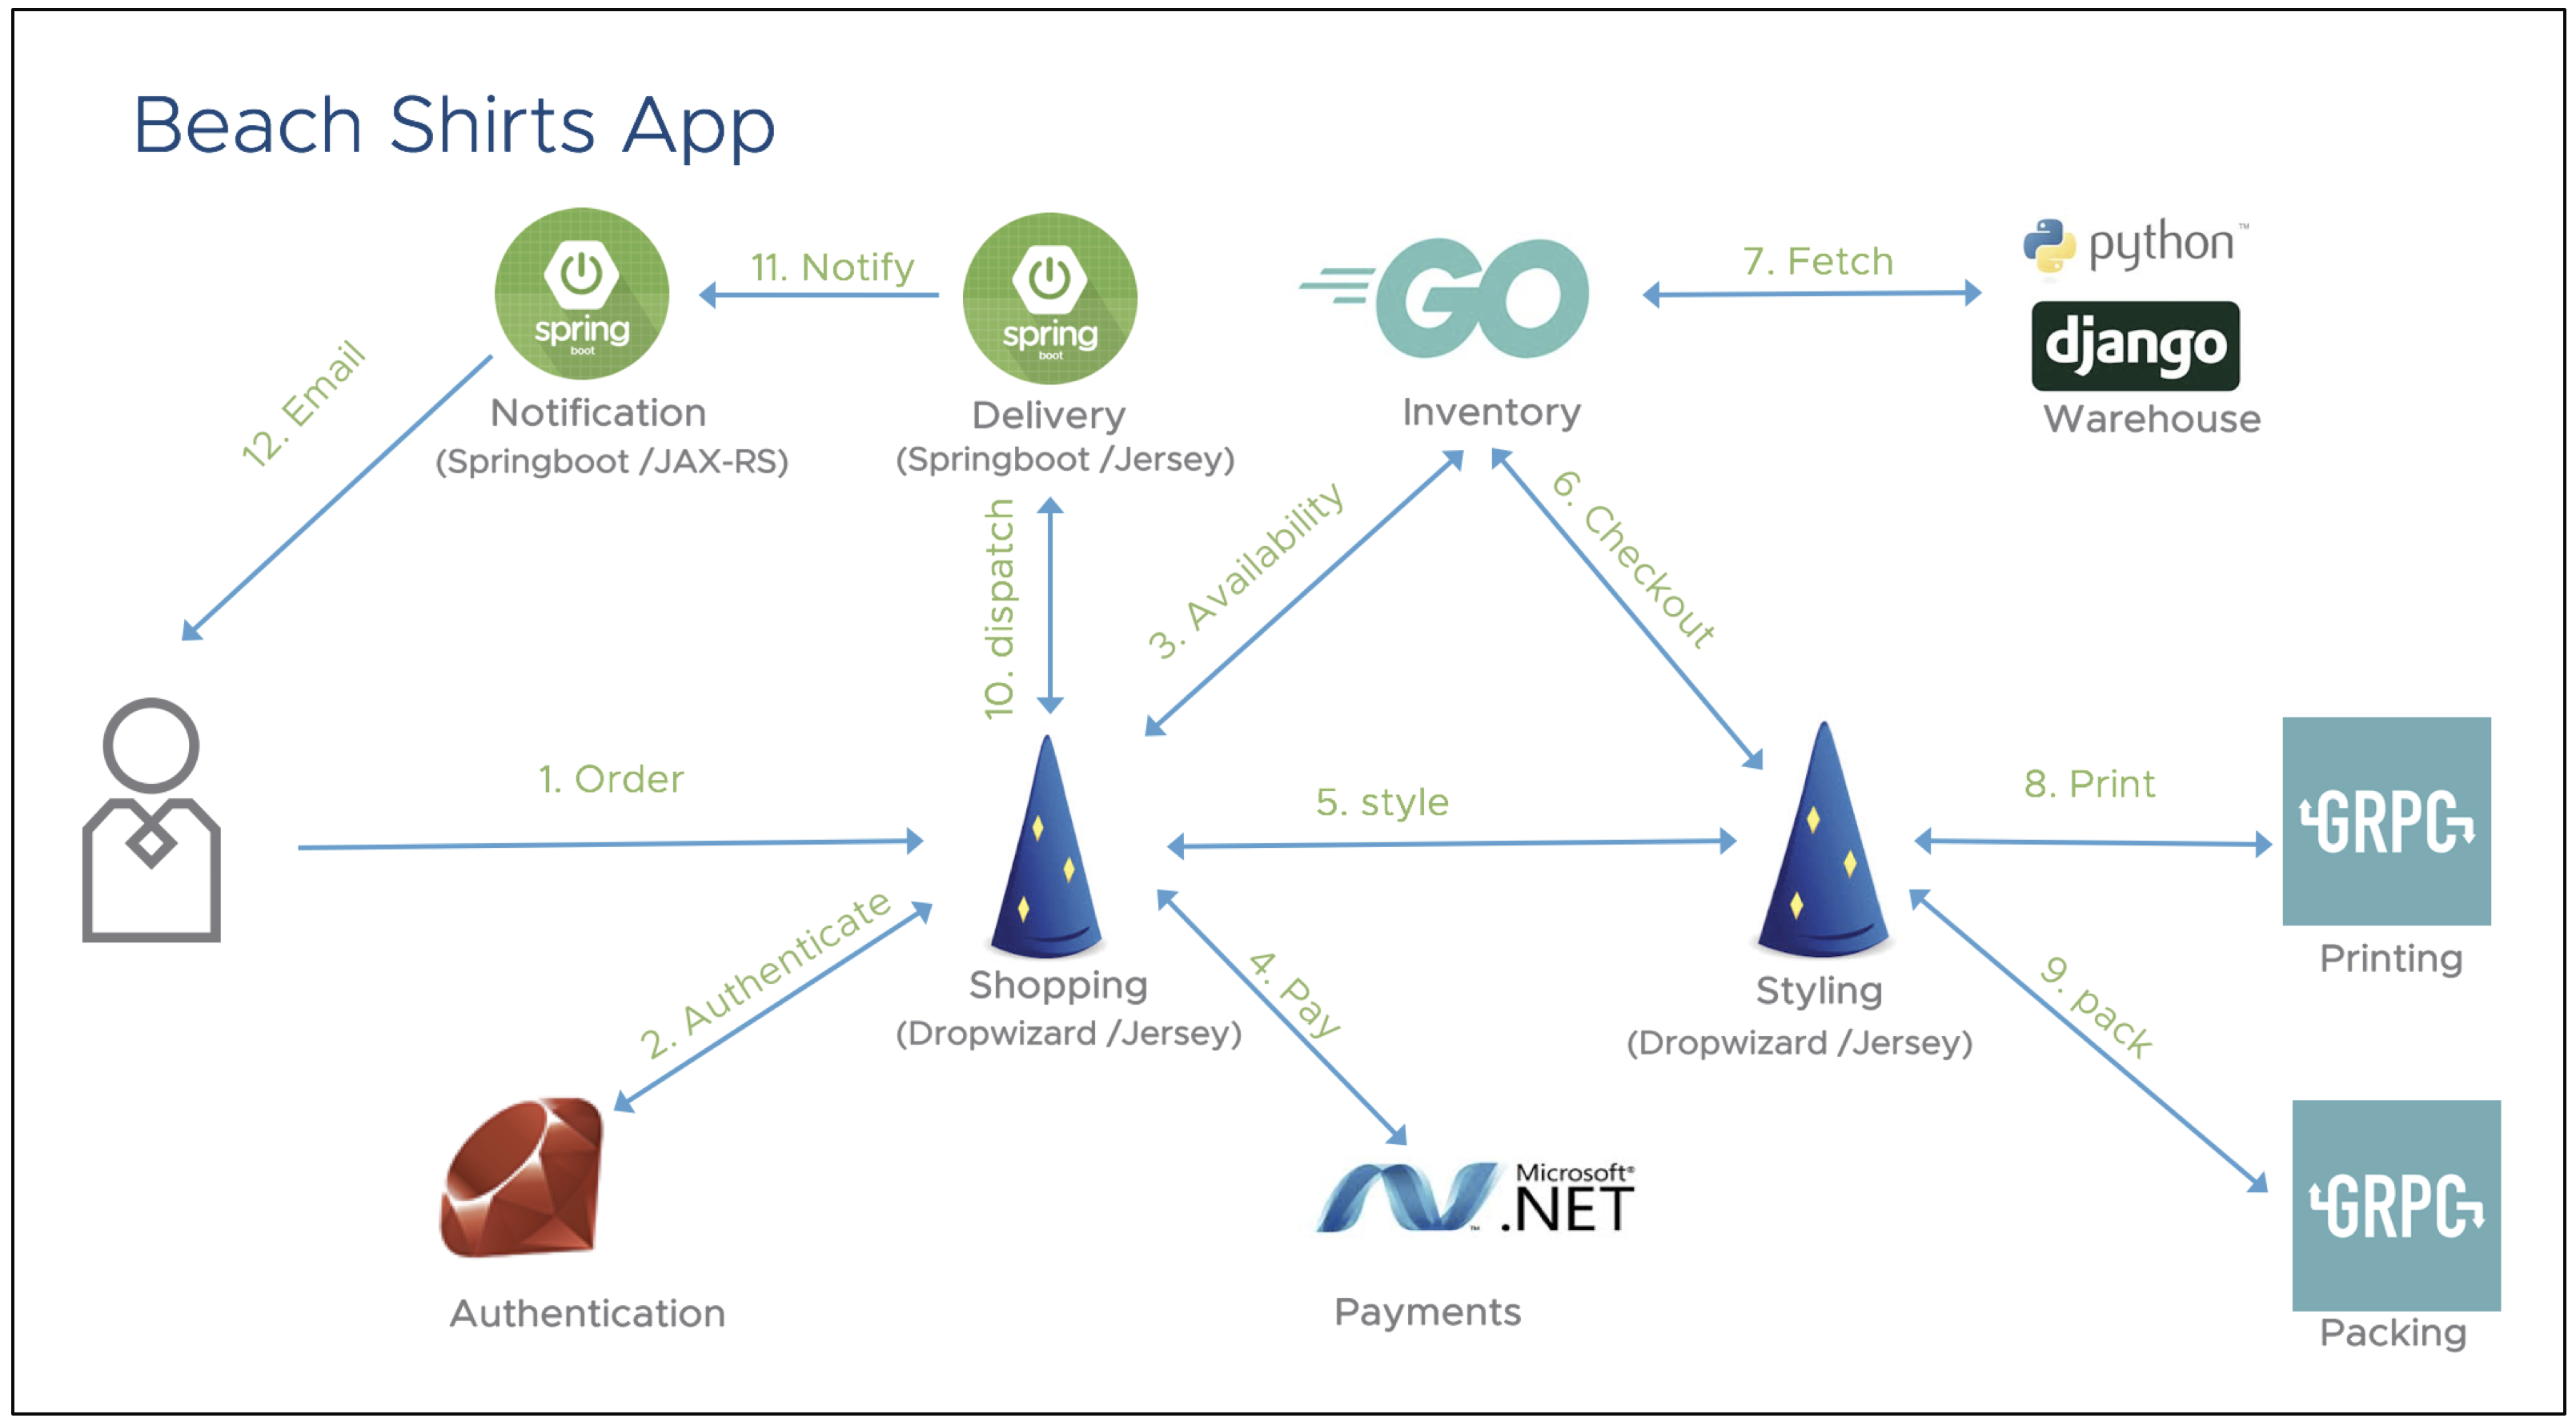
This article changes the narrative a bit to a real world scenerio and how Tracing benefits the day to day troubleshooting of cloud native or microservices based architectures. The following application was built by the Wavefront by VMware team, #BeachOps is a polyglot microservices-based sample application to order beach shirts. The following diagram shows the architecture of the BeachShirts app.
Troubleshooting in the Real World
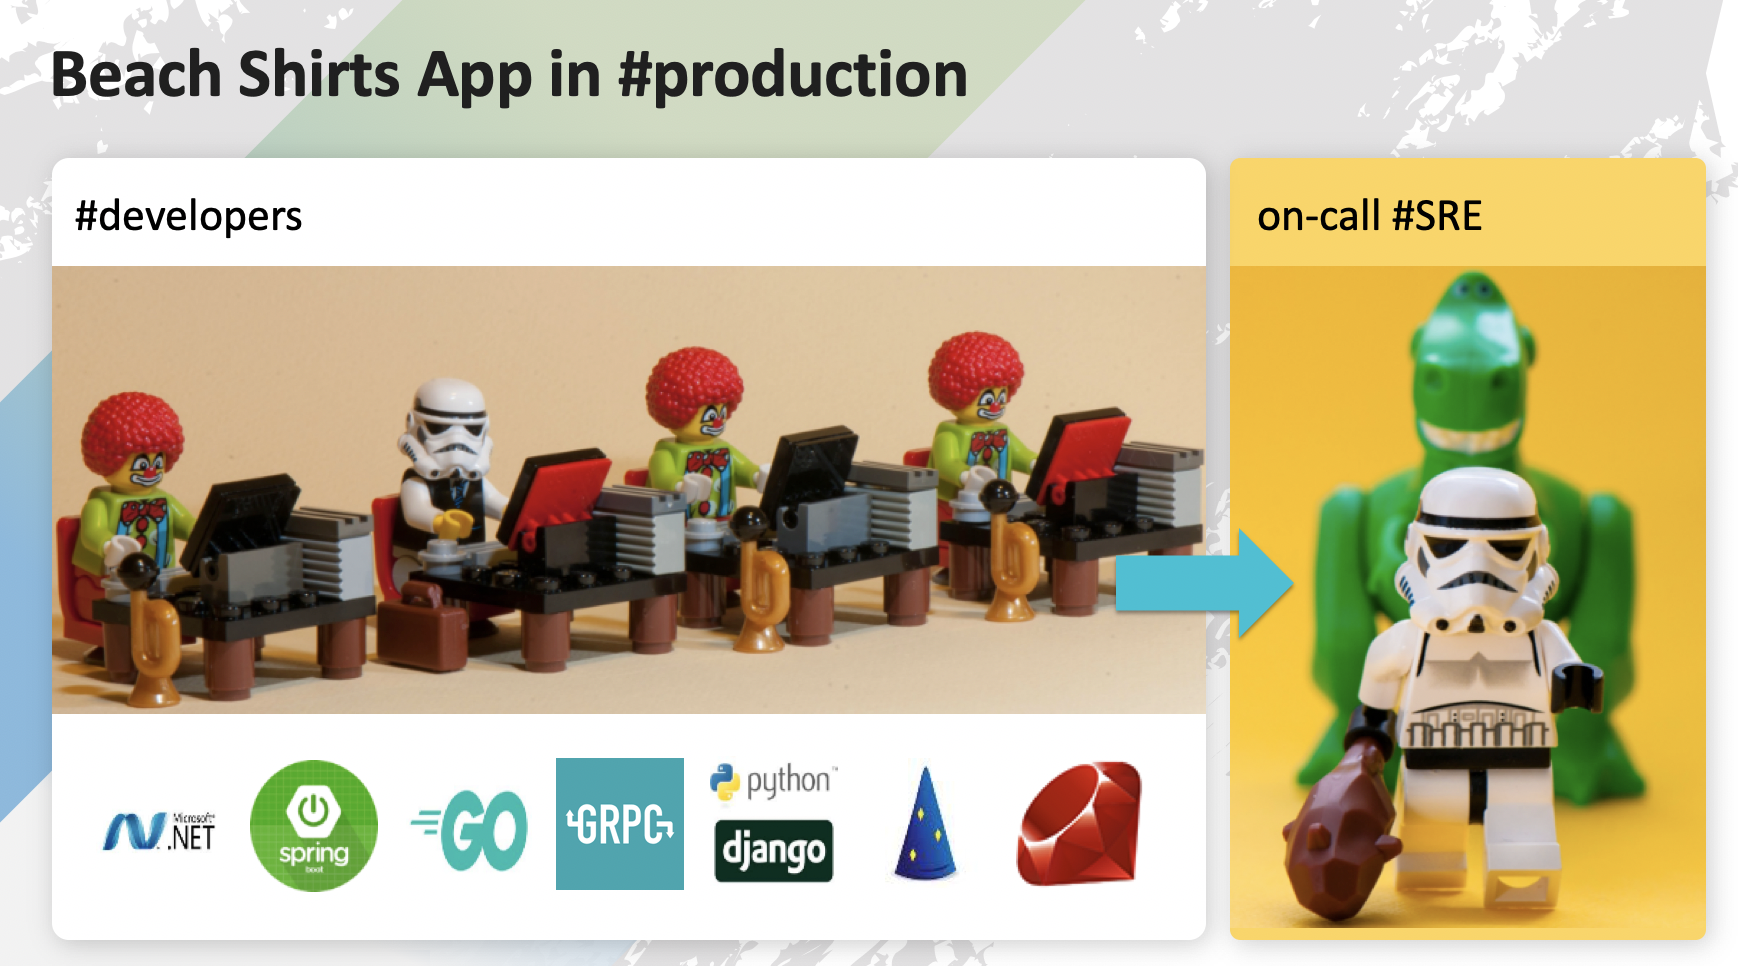
As you can see in the diagram above, this application is polyglot in nature. It was built by a bunch of developers who chose programming languages and frameworks of their choice. Each and every service owner was responsible for building the respective service, unit testing its functionality, making sure the service works well for negative and stress tests. After confirming that all the services work fine, the app was assembled together and deployed in production. Finally, the on-call SRE who did not write a single line of code was made responsible for making sure that the application SLA are met in production.
Beach Shirts Background
The app is primarily used by customers to order shirts. The SLA promised was in the order of milliseconds. After this app was deployed in production, millions of users tried to order shirts.
Most of the requests met the SLA of milliseconds but some of the requests took order of seconds instead of milliseconds.
- Why was that?
- Which service was the bottleneck?
- How can we solve this using Wavefront?
How can we follow the philosophy of #BeachOps and make sure that the SLA for this application is not violated?
Requirements to Ensure #BeachOps
You need a highly scalable Observability Platform to identify such SLA violation and then quickly diagnose and remediate the problem. Wavefront has built a 3D observability platform where 3D stands for 3-dimensional data - metrics, histograms, and traces. Let’s see how we can leverage the power of metrics, histograms, and traces for this scenario.
Alerts
When order shirts operation is taking seconds instead of milliseconds to finish, the on-call SRE engineer should be made aware of that SLA violation. The only way to do that is alerting. Alerting is a prerequisite for any Observability platform. For any on-call engineers, alerts are a fundamental starting point for the troubleshooting workflow. In Wavefront, On-call engineers don’t look at charts or create ad-hoc queries until an alert tells them to so. The philosophy is to aspire to sit beachside until an alert says otherwise. As soon as the alert goes off, it should notify the on-call engineer that the order shirts API is taking seconds instead of milliseconds.
Request Call Flow
The above alert is a good starting point but does not provide sufficient context as to why the order shirts API is taking seconds instead of milliseconds. The only way to figure that out is to get the request call flow as part of the alert.
In the below diagram, we can figure out the operation span dependency diagram to find out who is calling whom.
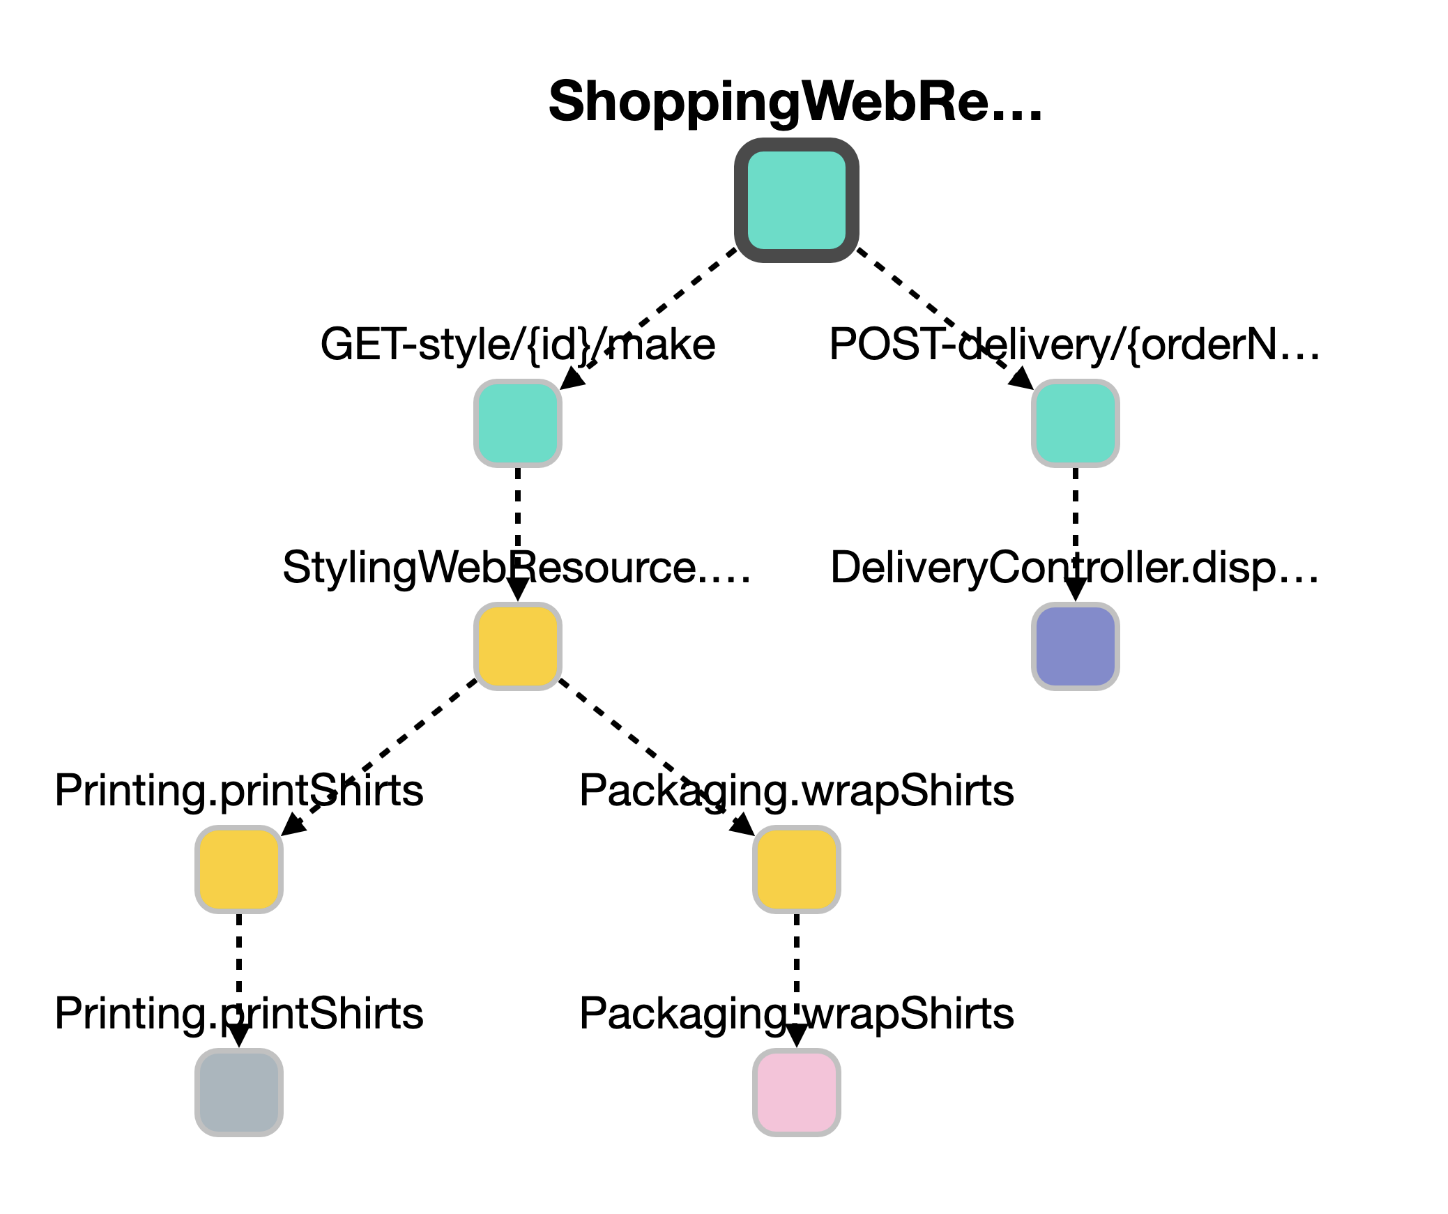
Service Dependency Map
While the above diagram gives you dependency of the various operations involved.
-
How about the service dependencies?
-
How do we get to know the health of those services involved in that request?
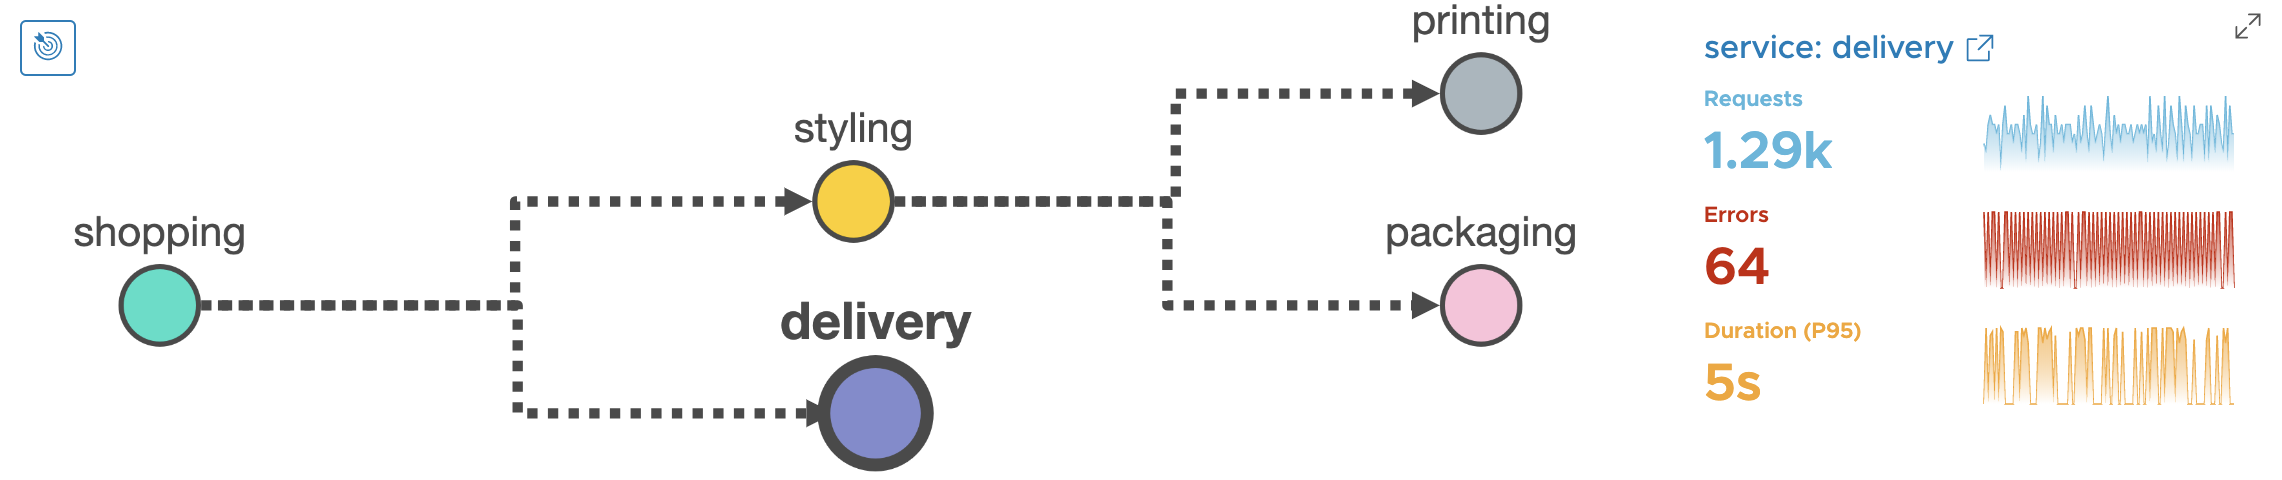
This is where the Wavefront Service Map comes handy. The below diagram tells you that shopping service has a dependency on styling and delivery services. And styling service has a dependency on printing and packaging services.
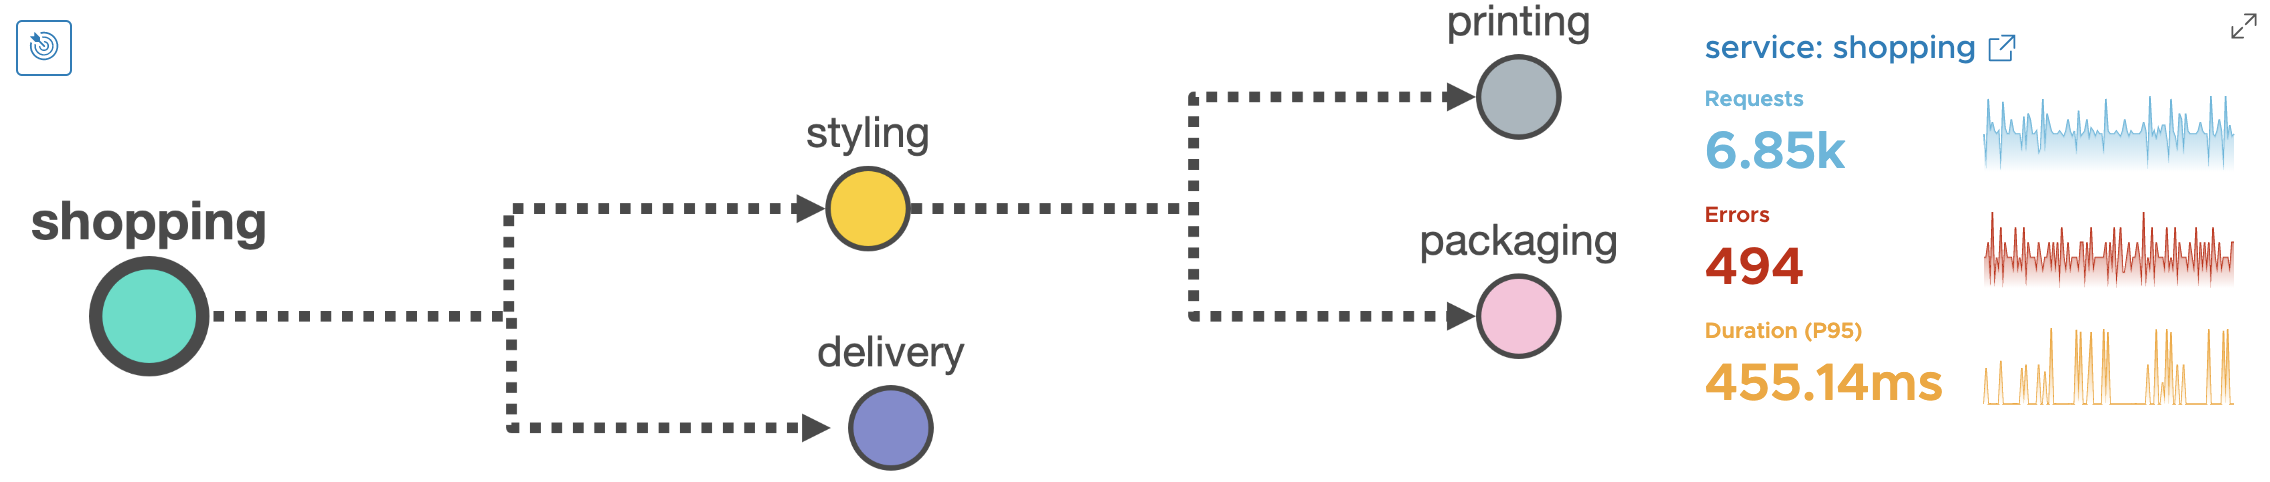
Not only does it give you service dependencies, but it also gives you the health of the individual service. This is done with the help of RED metrics. Here RED stands for Requests, Errors and Duration.
Here Requests and Errors are counter metrics recorded in Wavefront. ‘D’ which stands for Duration is a first-class distribution (a.k.a. histogram) recorded in Wavefront.
Notice that for shopping service, we have ~7.2% error rate and P95 latency of 455 milliseconds. Let’s see how our other services fare -
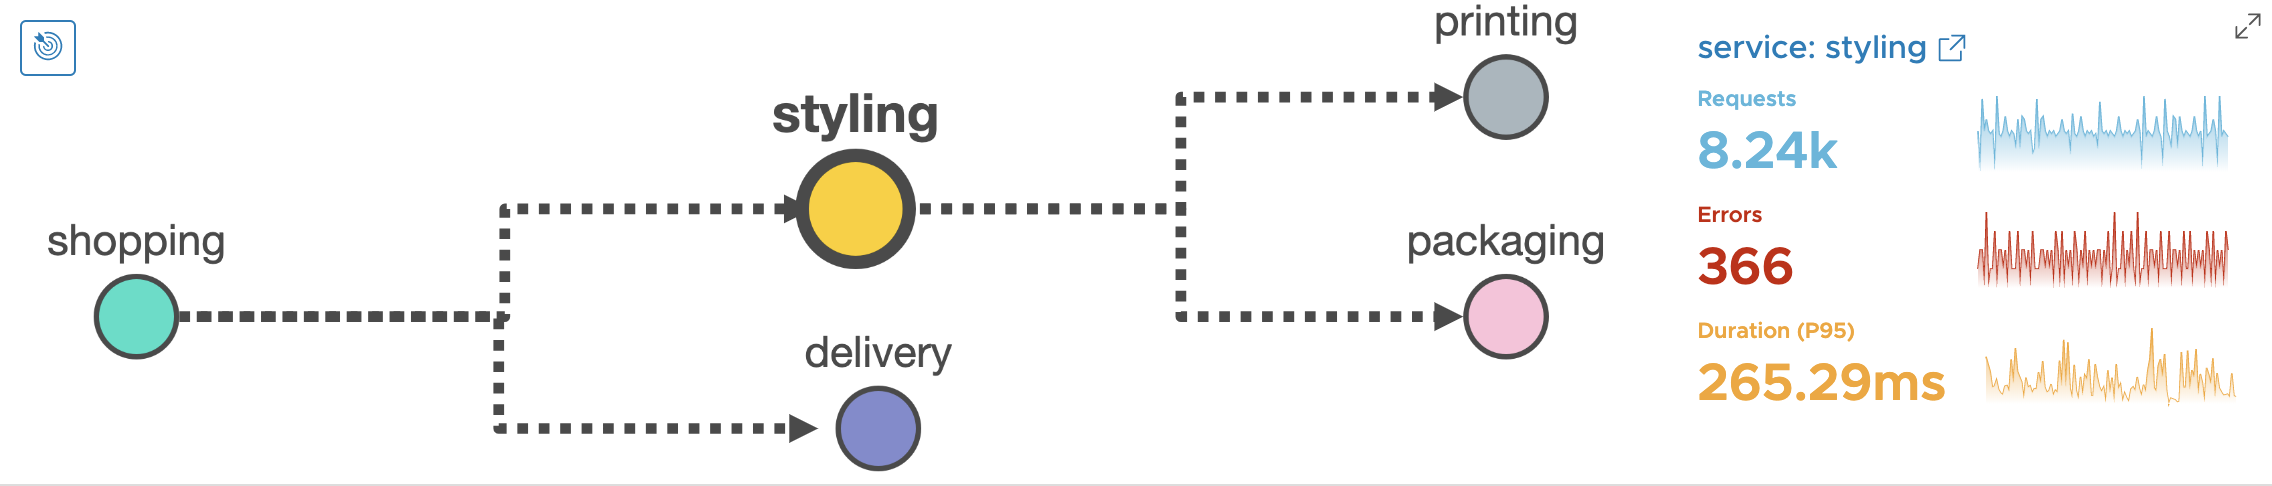
- Styling service has ~4.4% error rate and P95 latency of ~265ms.
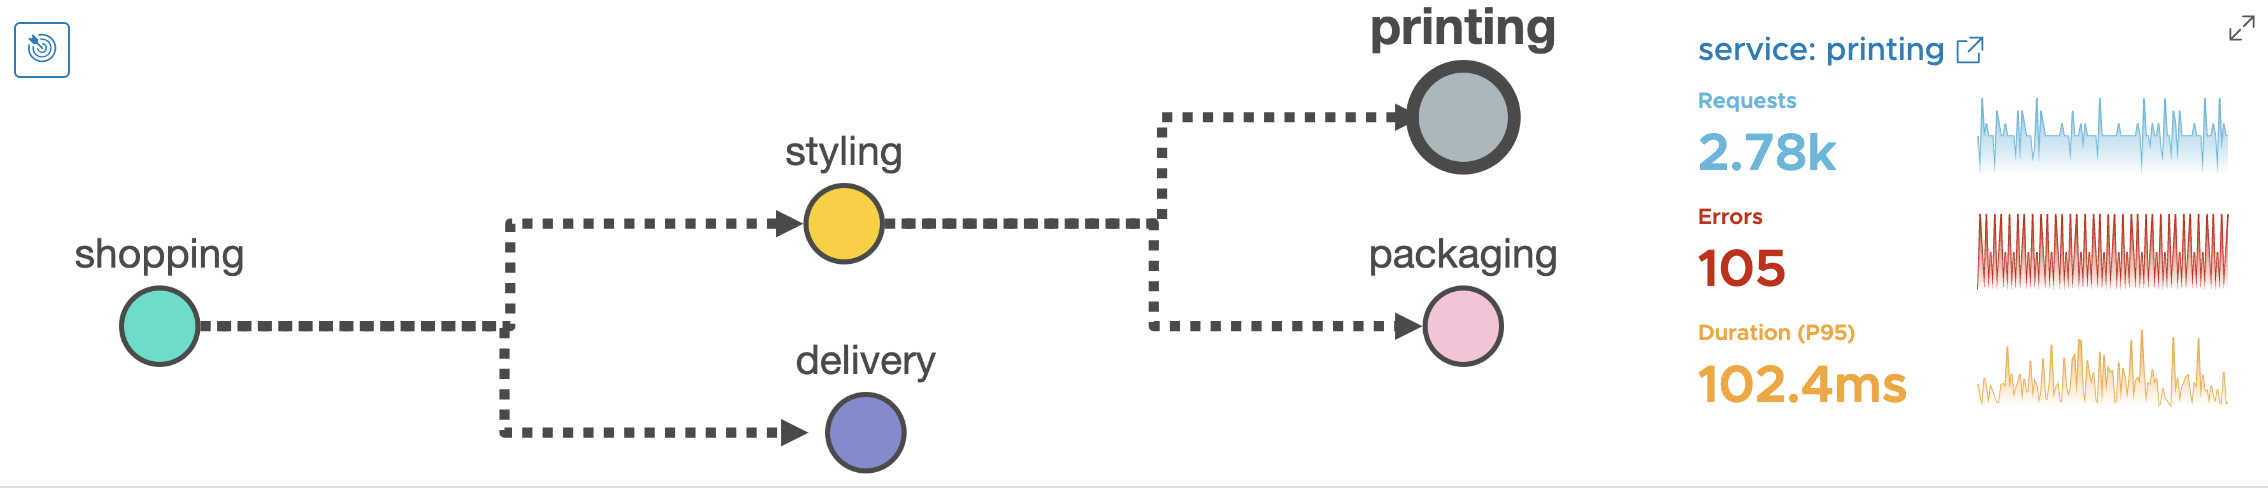
- Printing service has ~3.77% error rate and P95 latency of ~102ms.
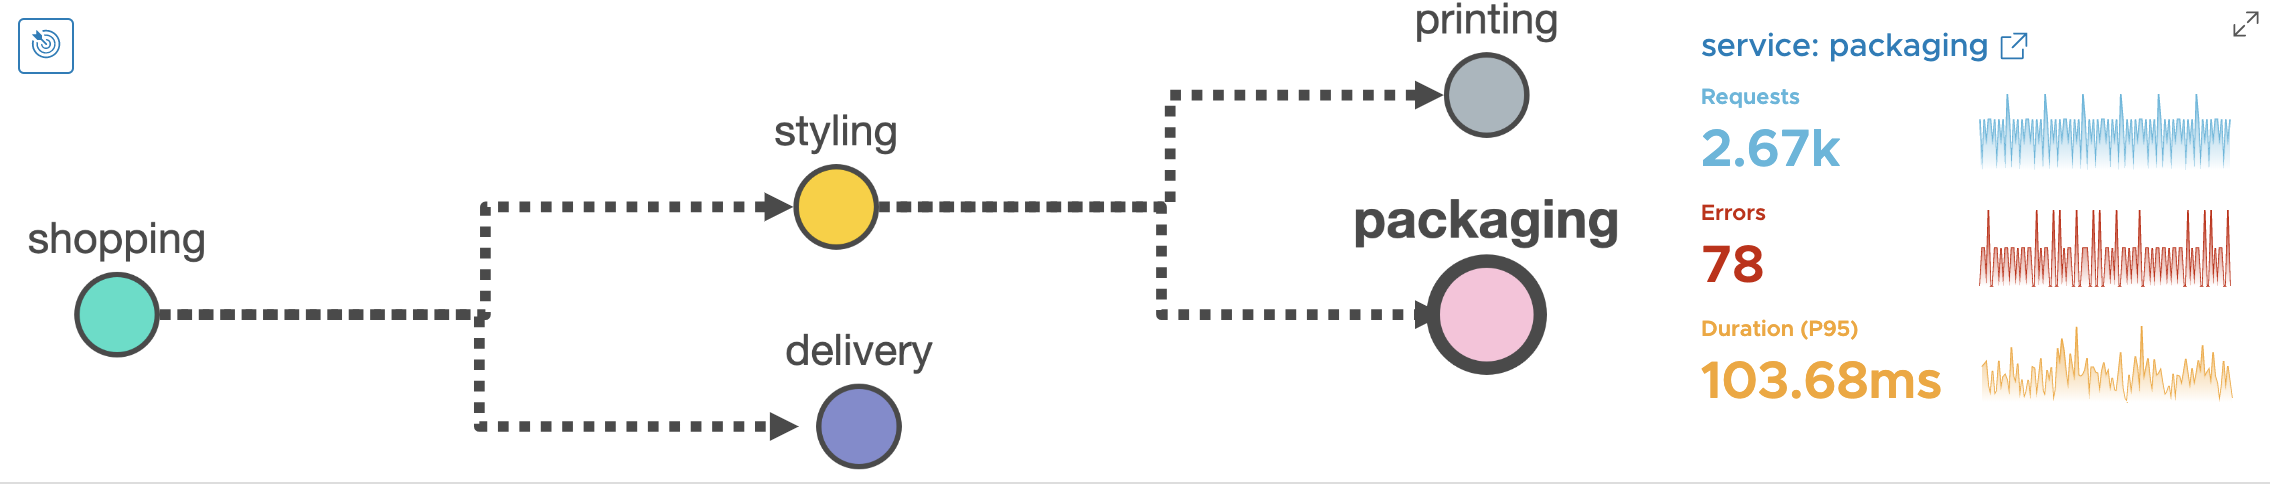
- Packaging service has ~2.92% error rate and P95 latency of ~103.68ms.
Now let’s look at the RED metrics for delivery service. Here the error rate for delivery service is 4.96% which is not too bad as compared to other services. But notice the P95 latency - it is 5 seconds! This is a clue to the on-call SRE that the bottleneck lies in the delivery service.
End to End Trace
Now that we have identified something is wrong with the delivery service, let’s confirm the same with an end to end trace. An end to end trace is the temporal view of the span dependencies for a single operation, in this case, the orderShirts API. Notice in the below diagram, the end to end trace is taking 5.35 seconds which is really bad! Just by a quick glance, it is easy to blame the shopping service and page the service owner for shopping service.
But by virtue of an end to end distributed-trace, it is evident that the bottleneck lies in delivery service instead of the shopping service.
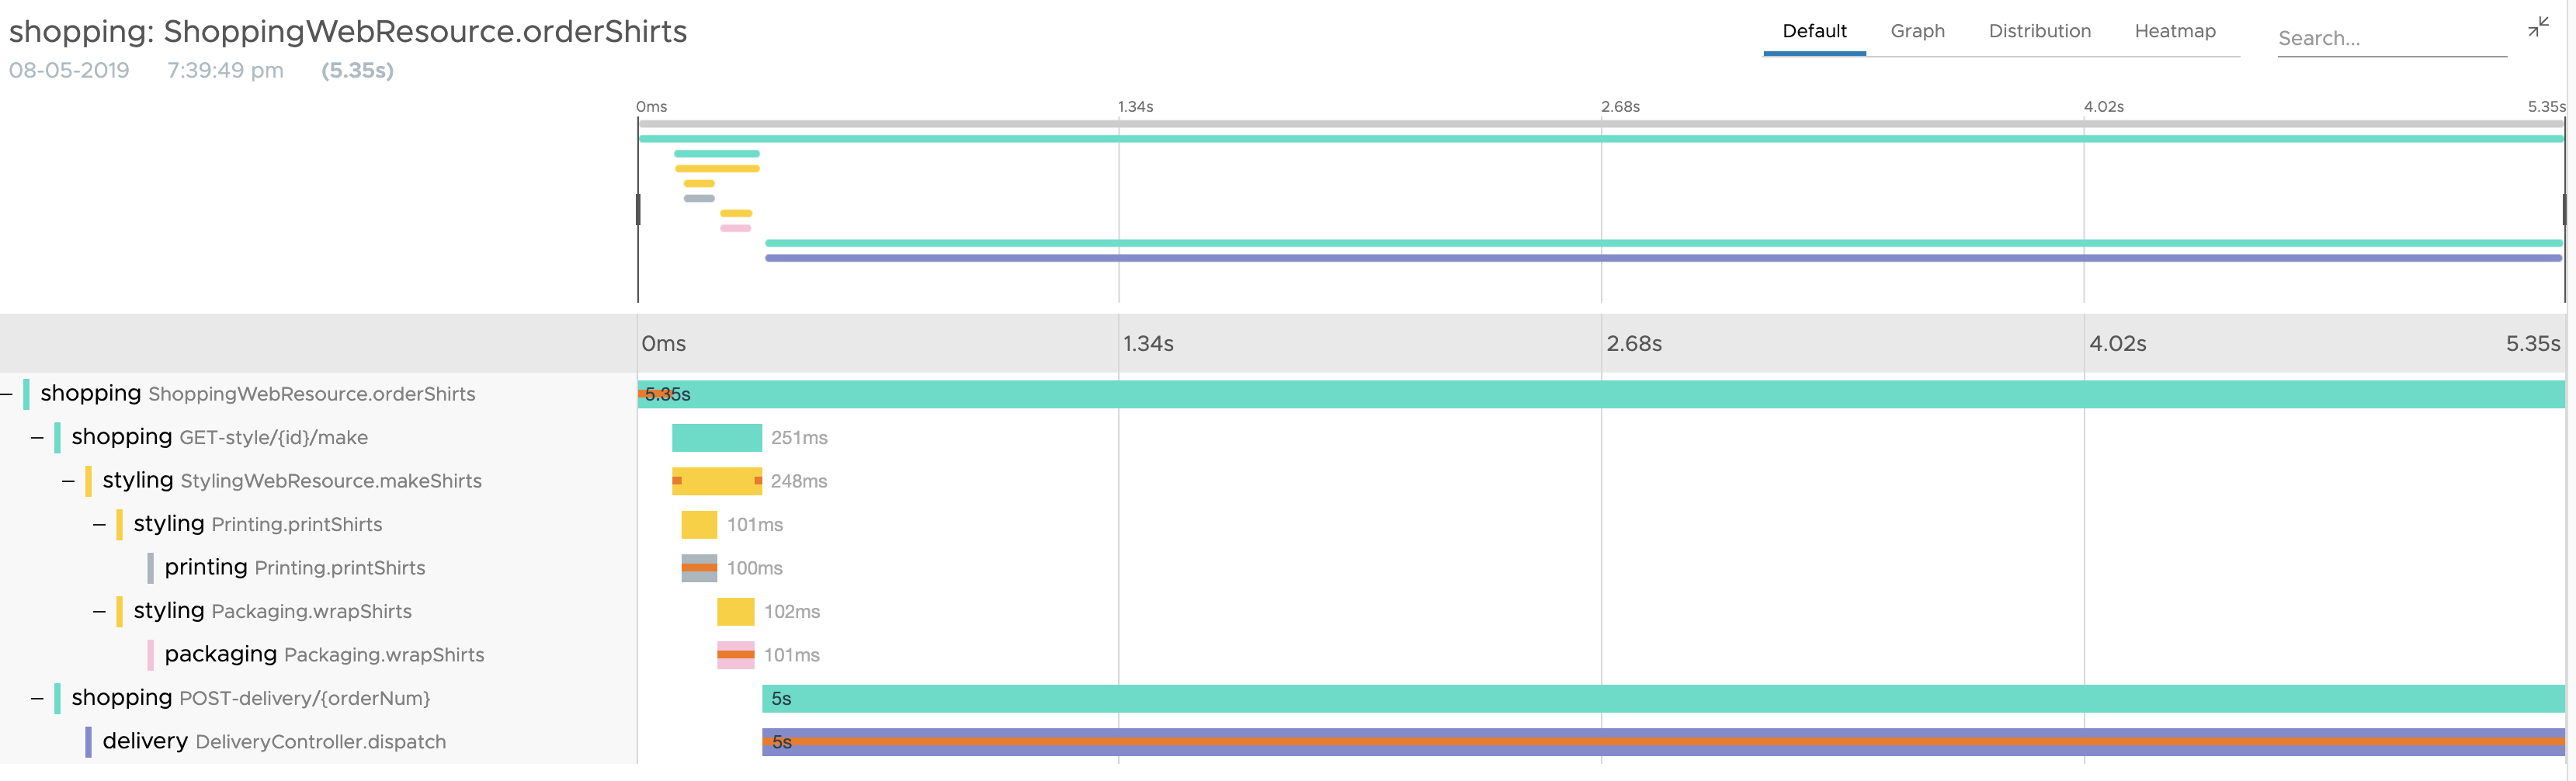
In the below diagram notice that the end to end trace is taking 5.35 seconds. The bulk of those 5.35 seconds is spent in delivery service. Here DeliveryController.dispatch operation is taking 5 seconds.
Let’s examine the operation in a bit more detail. Is that operation always taking 5 seconds?
The span dependency graph combined with Span RED metrics will help us find out if this is normal or anomalous behavior.
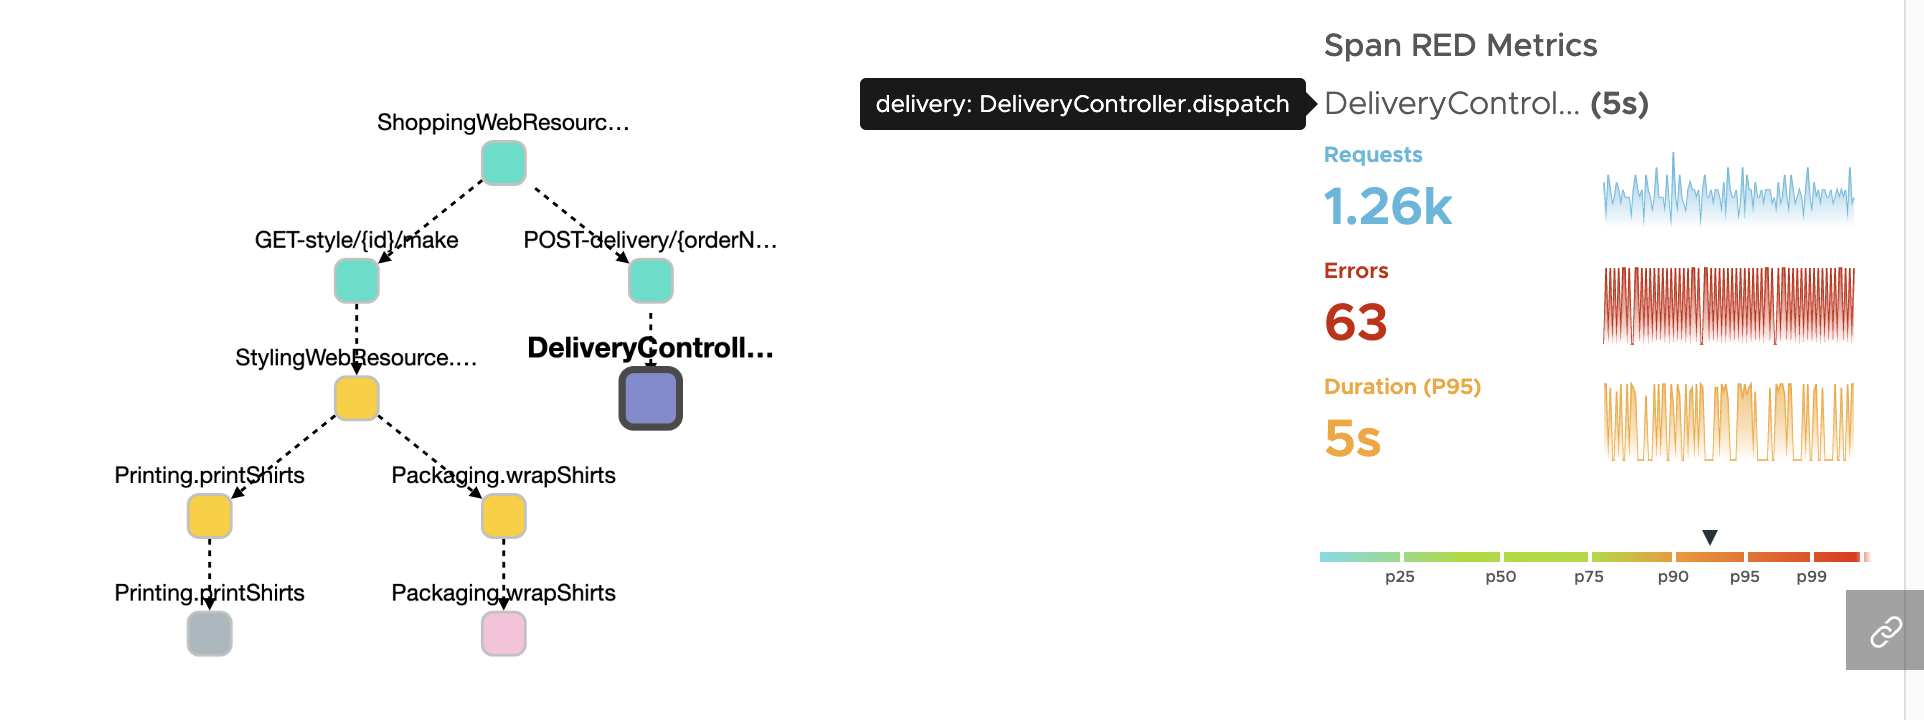
In the above diagram, notice that the DeliveryController.dispatch which is taking 5 seconds is outlier in nature. I can make that claim by looking at the outlier scale in the above diagram to confirm that the span is > p90.
If we want to convert this statistical information into simple English terms, then this implies that this particular span latency is greater than the 90th percentile for all those operations. This means the 5 seconds latency makes it fall in the outlier 10% bucket instead of the normal 90% bucket. Had the latency in this case been closer to the median, then we could have claimed that DeliveryController.dispatch is always slow.
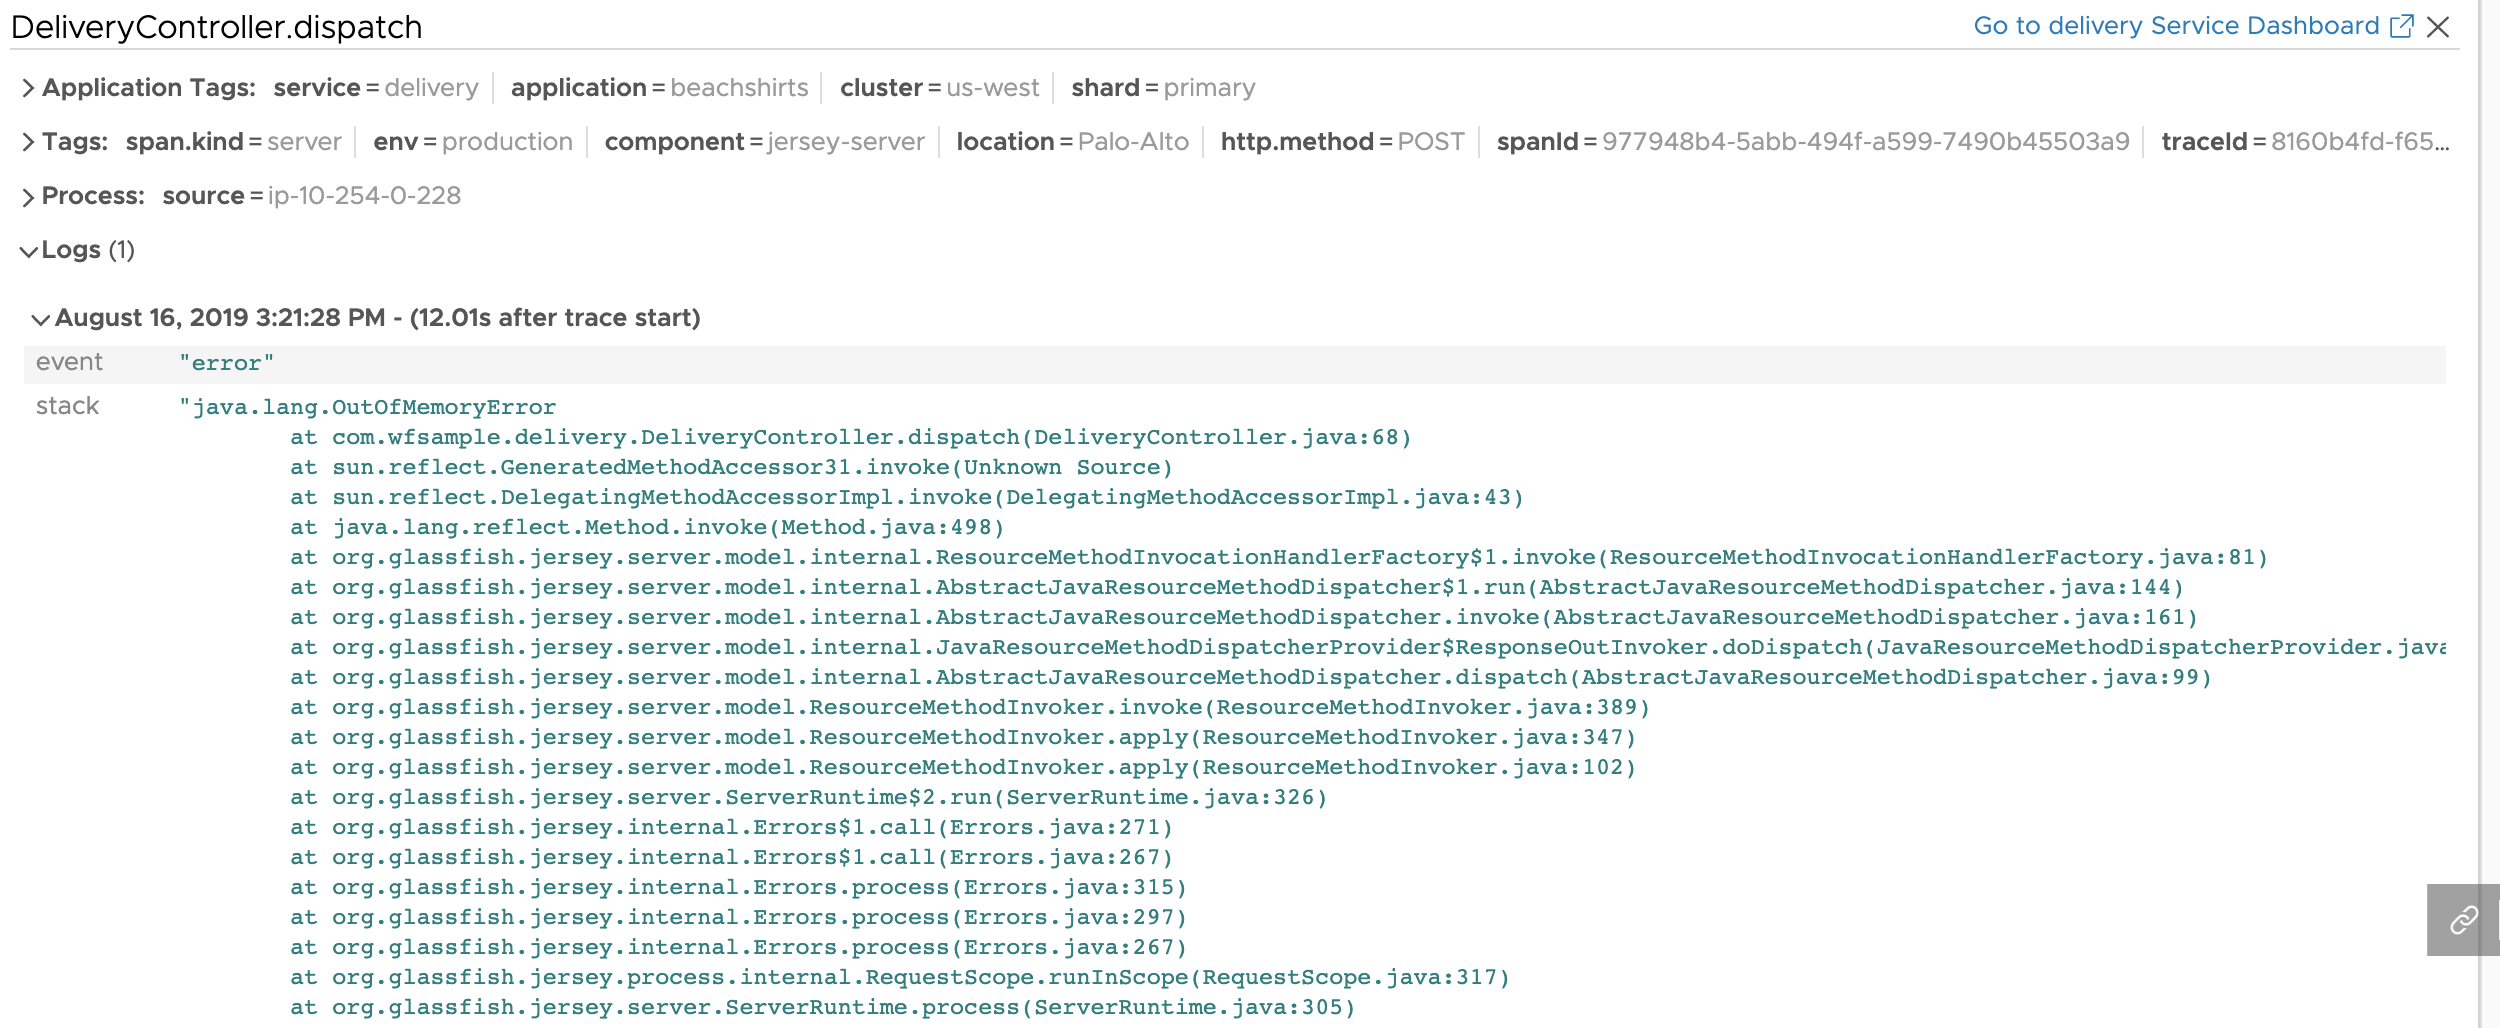
Span Logs
Now that we have identified that delivery service is slow, let’s examine as to why the service is slow. Opentracing has support for span logs. With the help of span logs, you can pinpoint exactly why DeliveryController.dispatch operation is slow.
Summary
In this particular example, you witnessed an application where the SLA was violated. We also showed you how a true Observability platform such as Wavefront helps you debug problems faster. But if you want to take advantage of Wavefront, as a developer, you are not only responsible for building your service but also fully instrumenting it. You should be reporting valuable traces and spans to a sophisticated and highly scalable observability platform, create relevant alerts and then sit back and relax at the beach!
- Harnessing the value of metrics, histograms, and traces all in one combined Observability platform.
- Identifying problems with the help of alerting.
- Providing context.
- Pinpointing the bottleneck service.
- Remediating the problem.