Application Inventory and Tracing with Jaeger and Wavefront
The team normally attempts to blog about “art of the possible” and thought provoking topics. This blog is a different as it fits into more of the “How-to” category but it will also serve as an introduction to Observability and Monitoring of microservices-based applications.
What is Observability anyway?
Early on in my IT career, I was responsible for monitoring and troubleshooting of systems and applications. The traditional Operations role is why I initially struggled with the term Observability. Many folks believe it is a fancy word made up by marketing teams to justify something new.
If you search for Observability on the web you will get a variety of views and opinions. I found a blog from Cindy Sridharan that really digs into the topic of Monitoring and Observability and the final paragraph is genius!
Observations can lead a developer to the answers, it can’t make them necessarily find it. The process of examining the evidence (observations) at hand and being able to deduce still requires a good understanding of the system, the domain as well as a good sense of intuition. No amount of “Observability” or “monitoring” tooling can ever be a substitute to good engineering intuition and instincts.
Kubernetes Setup with Wavefront
In this scenario, I built a Kubernetes Cluster using the Azure Kubernetes Service.
Wavefront has detailed installation instructions which I normally recommend using. But I ran through this several times and felt they were a bit too detailed and had to navigate several different web pages. So I built my own set of instructions and made them available in a Github Repo.
Step 1: Deploy a Wavefront Proxy in Kubernetes
Download jaeger-wavefront.yaml to your system. Edit the file and set the following environment variables, container port and service port specifications.
Wavefront
env:
- name: WAVEFRONT_URL
    value: <YOUR WAVEFRONT URL>
- name: WAVEFRONT_TOKEN
    value: <YOUR WAVEFRONT TOKEN>
Wavefront Jaeger Integrations
env:
# Jaeger Tracing Environment Variable
- name: WAVEFRONT_PROXY_ARGS
    value: --traceJaegerListenerPorts <YOUR JAEGER PORT>
Container Port
Update the container port with the same port specified in the WAVEFRONT_PROXY_ARGS environment variable.
# Jaeger Tracing Port
- containerPort: <YOUR JAEGER PORT>
  protocol: TCP
Service Port
Update the Service Port with the same Jaeger Port specified in the WAVEFRONT_PROXY_ARGS environment variable.
# Added for Jaeger Tracing
- name: jaeger
  port: <YOUR JAEGER PORT>
  targetPort: <YOUR JAEGER PORT>
  protocol: TCP
Run kubectl create -f jaeger-wavefront.yaml to deploy the proxy.
The Wavefront proxy and a wavefront-proxy service should now be running in Kubernetes.
Step 2: Deploy Kube-State Metrics Service in Kubernetes
Deploy the kube-state-metrics Service
Download kube-state.yaml to your system and run kubectl create -f kube-state.yaml.
The kube-state-metrics service should now be running on your cluster.
Steps 3: Deploy Wavefront Kubernetes Collector
Download the wavefront-collector-dir to your system:
- 0-collector-namespace.yaml
- 1-collector-cluster-role.yaml
- 2-collector-rbac.yaml
- 3-collector-service-account.yaml
- 4-collector-deployment.yaml
Edit 4-collector-deployment.yaml as follows:
Edit YOUR CLUSTER NAME to uniquely identify your Kubernetes cluster.
 command:
 - /wavefront-collector
 - --source=kubernetes.summary_api:''
 - --sink=wavefront:?proxyAddress=wavefront-proxy.default.svc.cluster.local:2878&clusterName=<YOUR CLUSTER NAME>&includeLabels=true
 - --v=2
Run kubectl create -f </path/to/wavefront-collector-dir>/ to deploy the collector on your cluster.
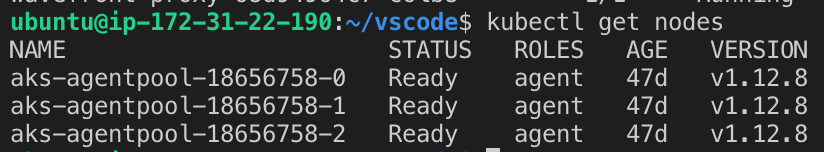
To verify the collector is deployed, run kubectl get pods -n wavefront-collector.
If you do not see metrics in the Kubernetes dashboard, check the logs from the collector and proxy pods.
Deploy an Application
In this scenario I used ACME Fitness which is built and maintained by our team. We suggest you clone and fork Repo for your own testing. Feel free to provide feedback too.
I have seen the application deployed on EKS, ECS, AKS, GKE, Cloud PKS and PKS.
Wavefront Dashboards
With Wavefront configured and the application running, you will need to generate some traffic for this to come to life. Shri on the team provides a traffic generator built with locust to help with this. I used in my environment.
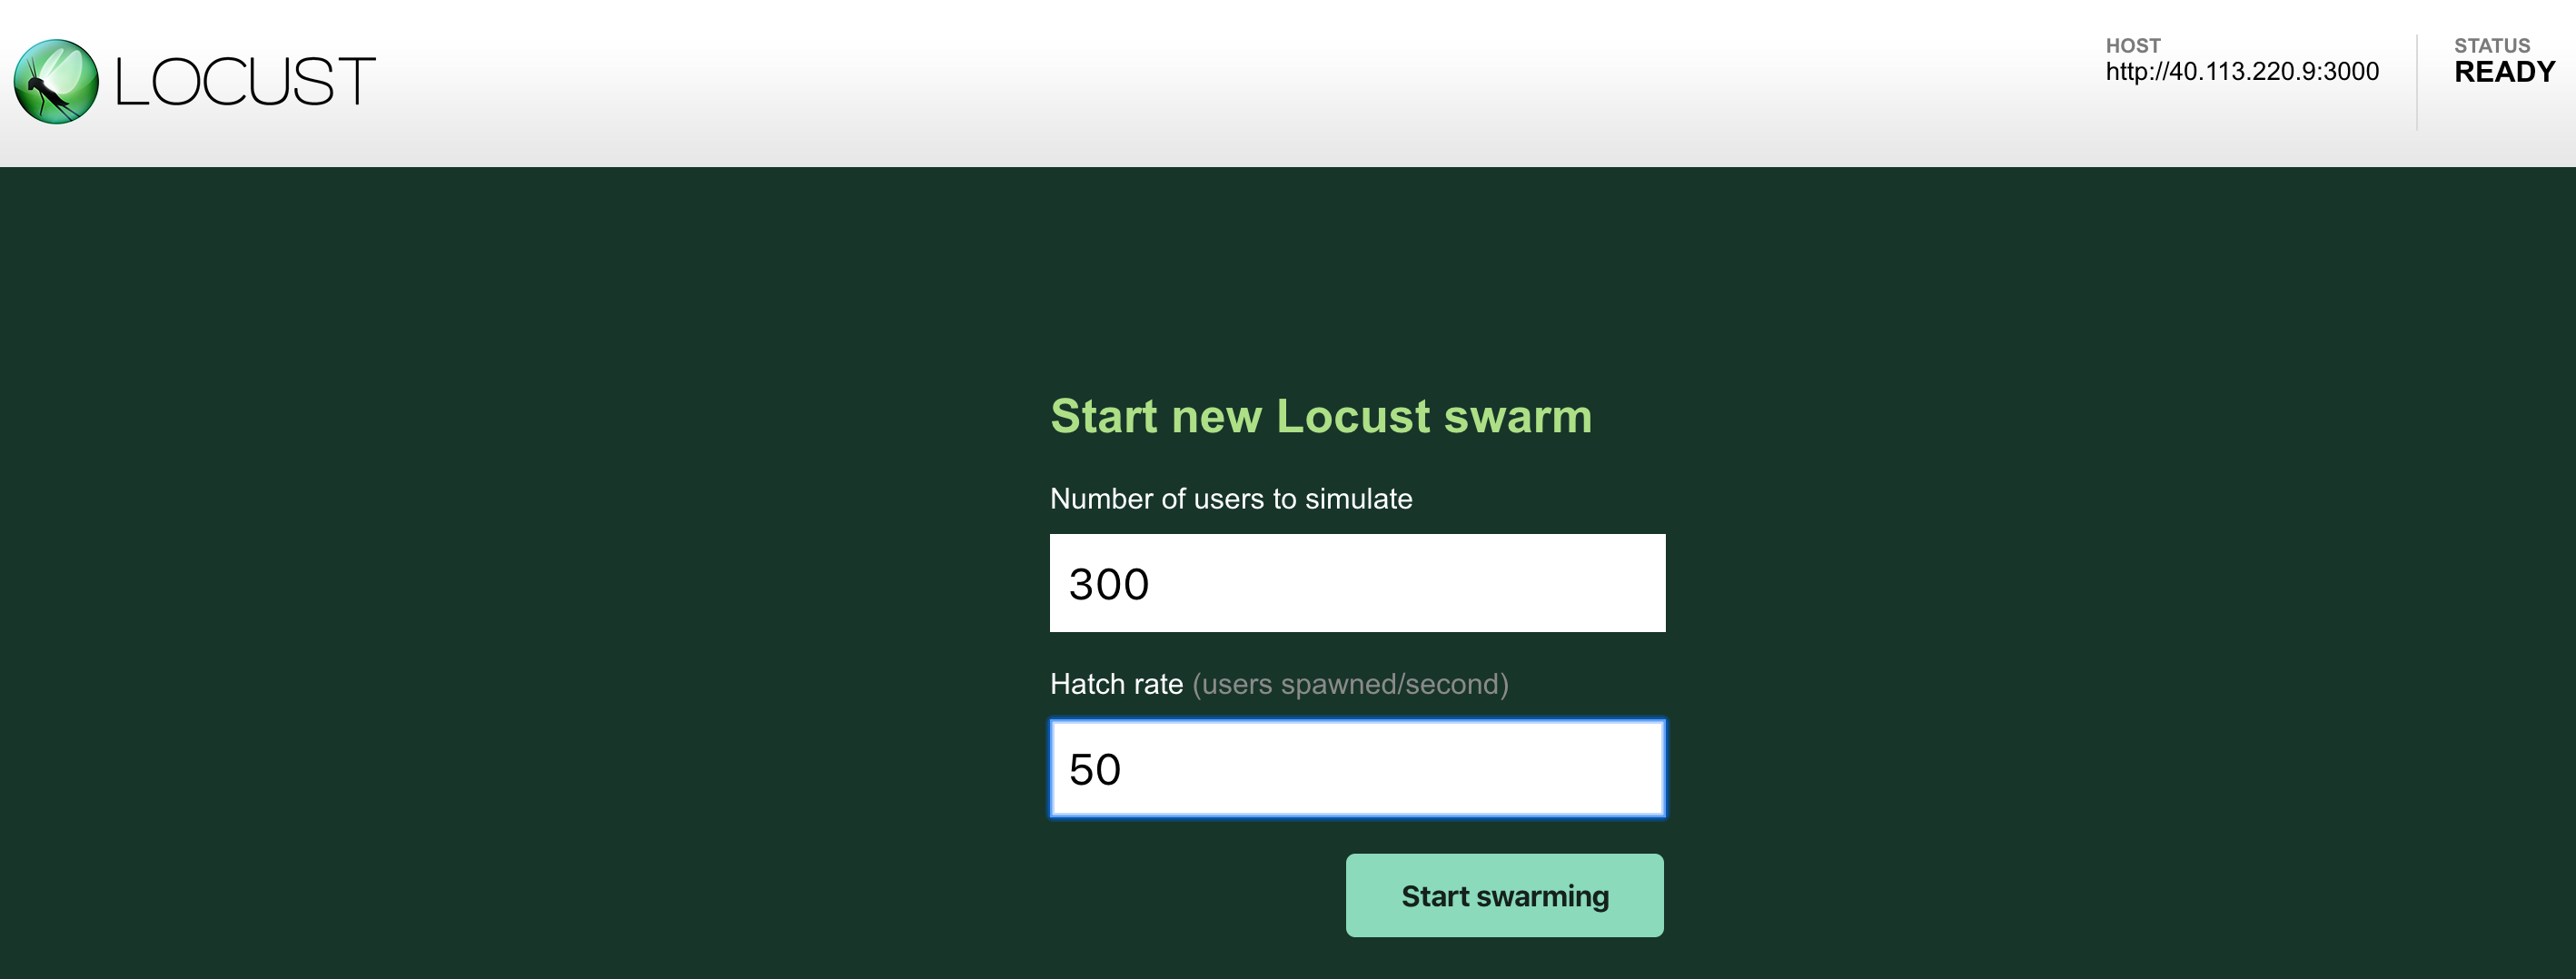
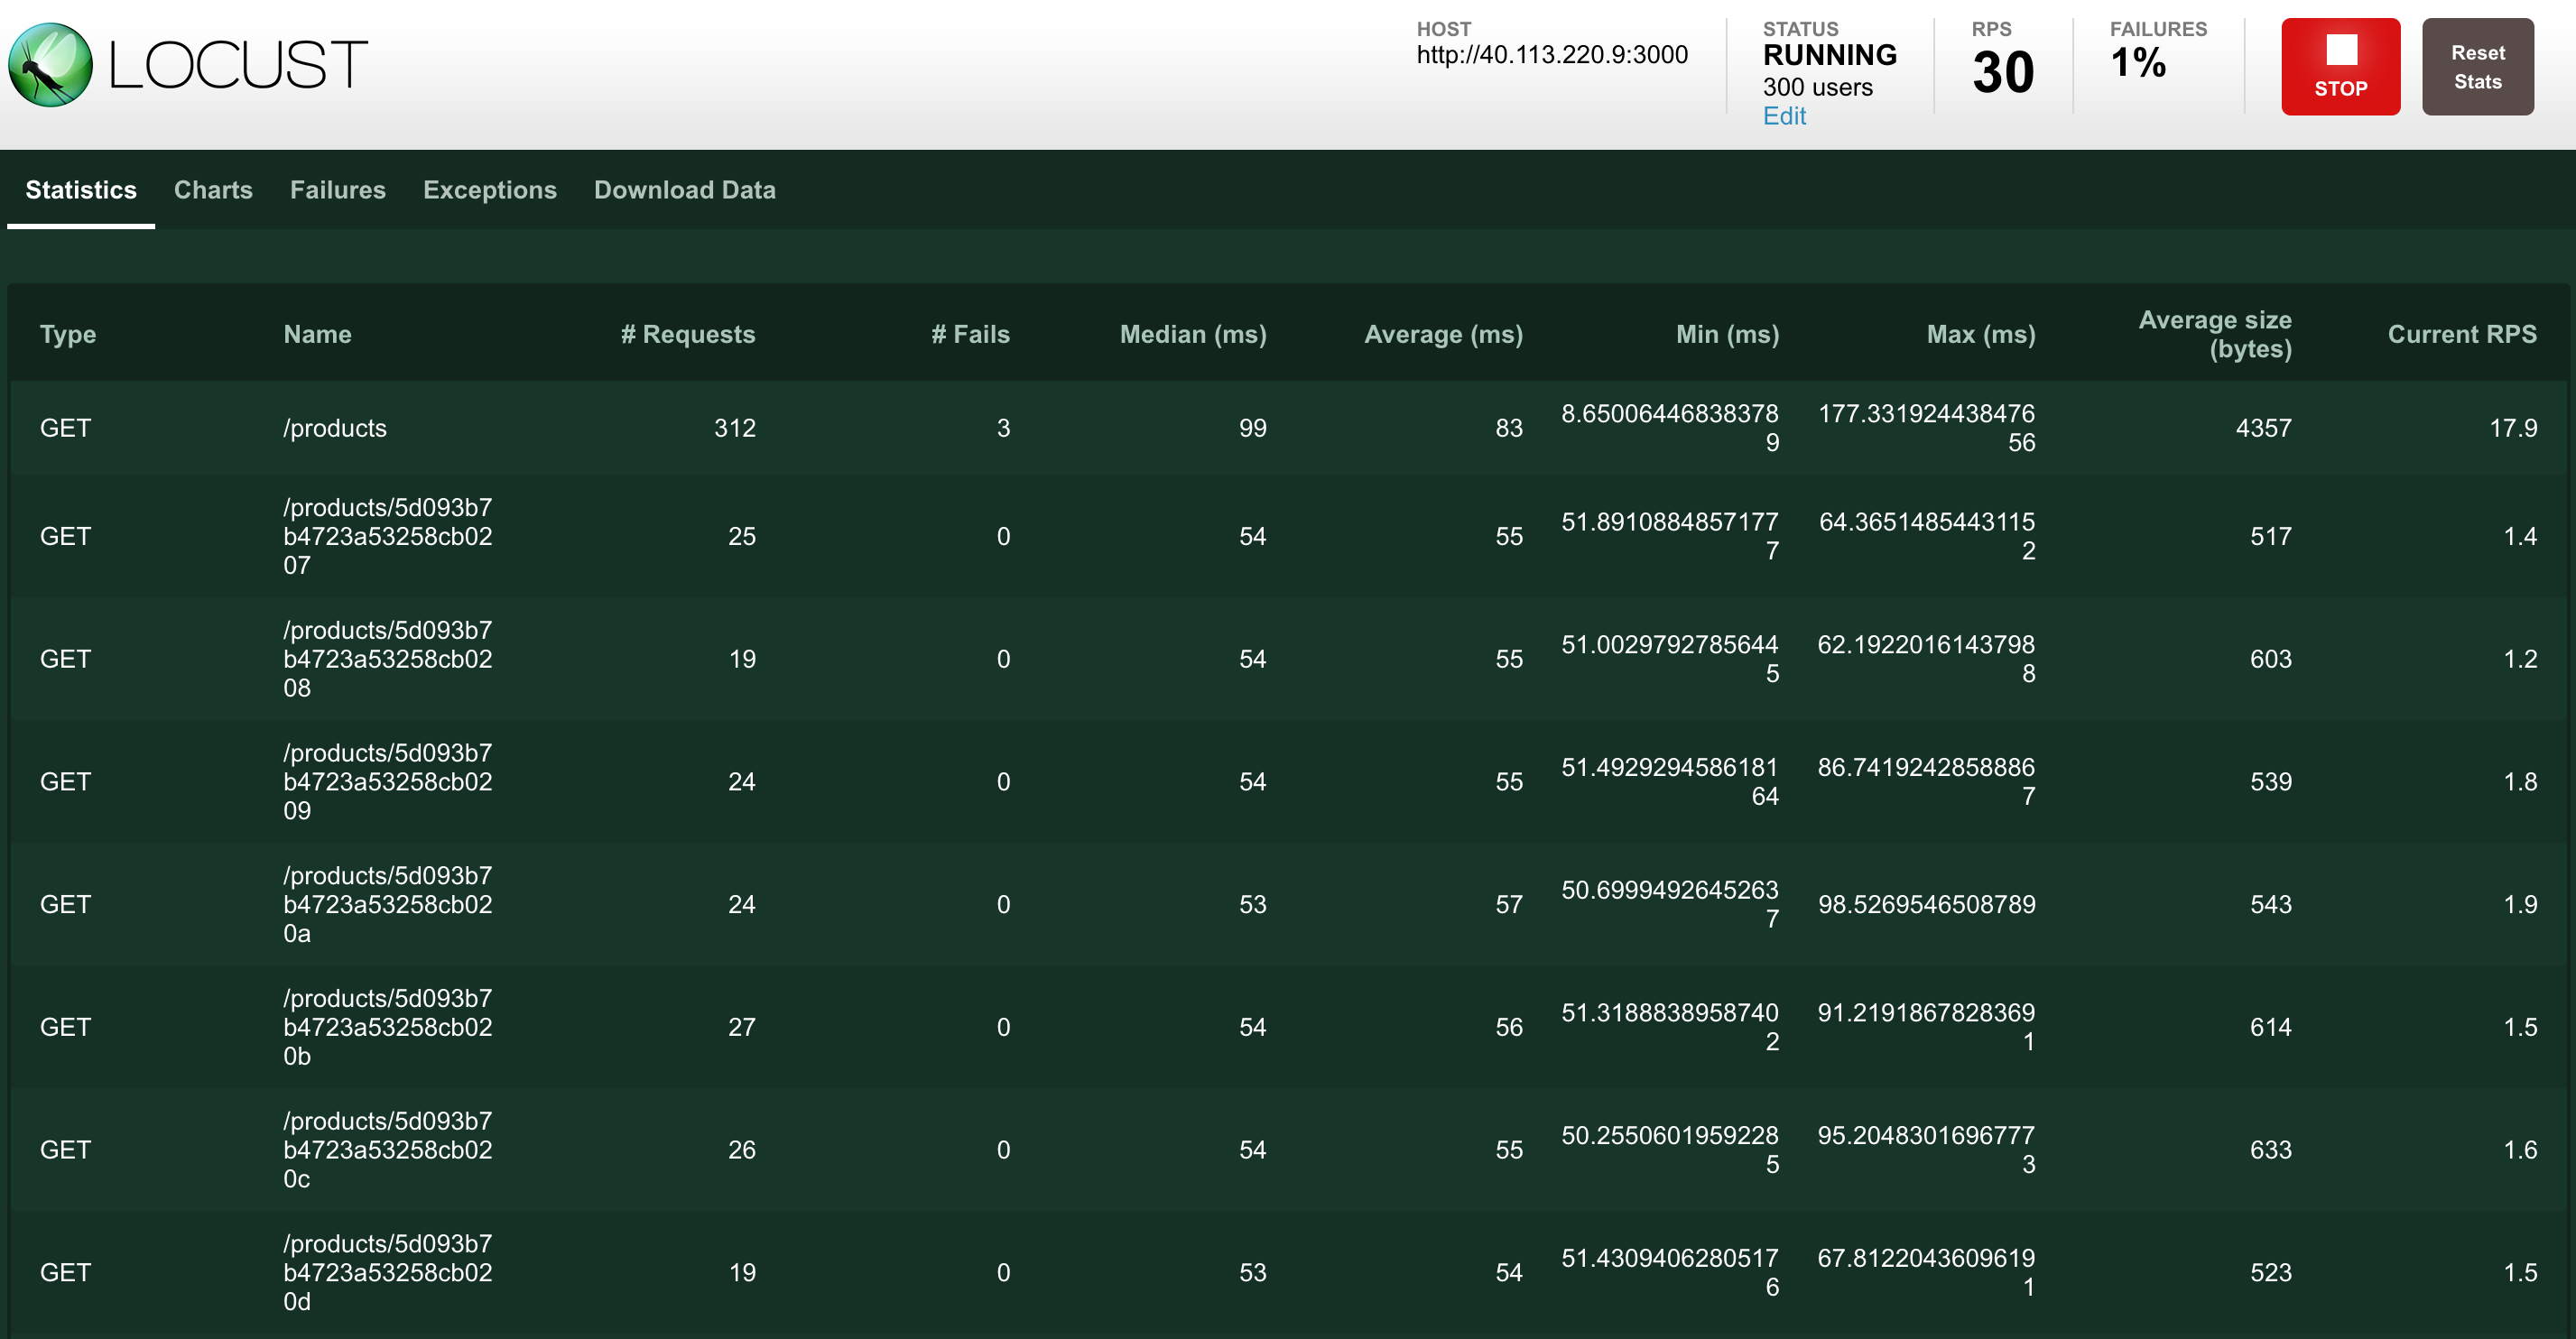
Now that traffic is being generated with locust, lets jump into Wavefront to see how things are looking there.
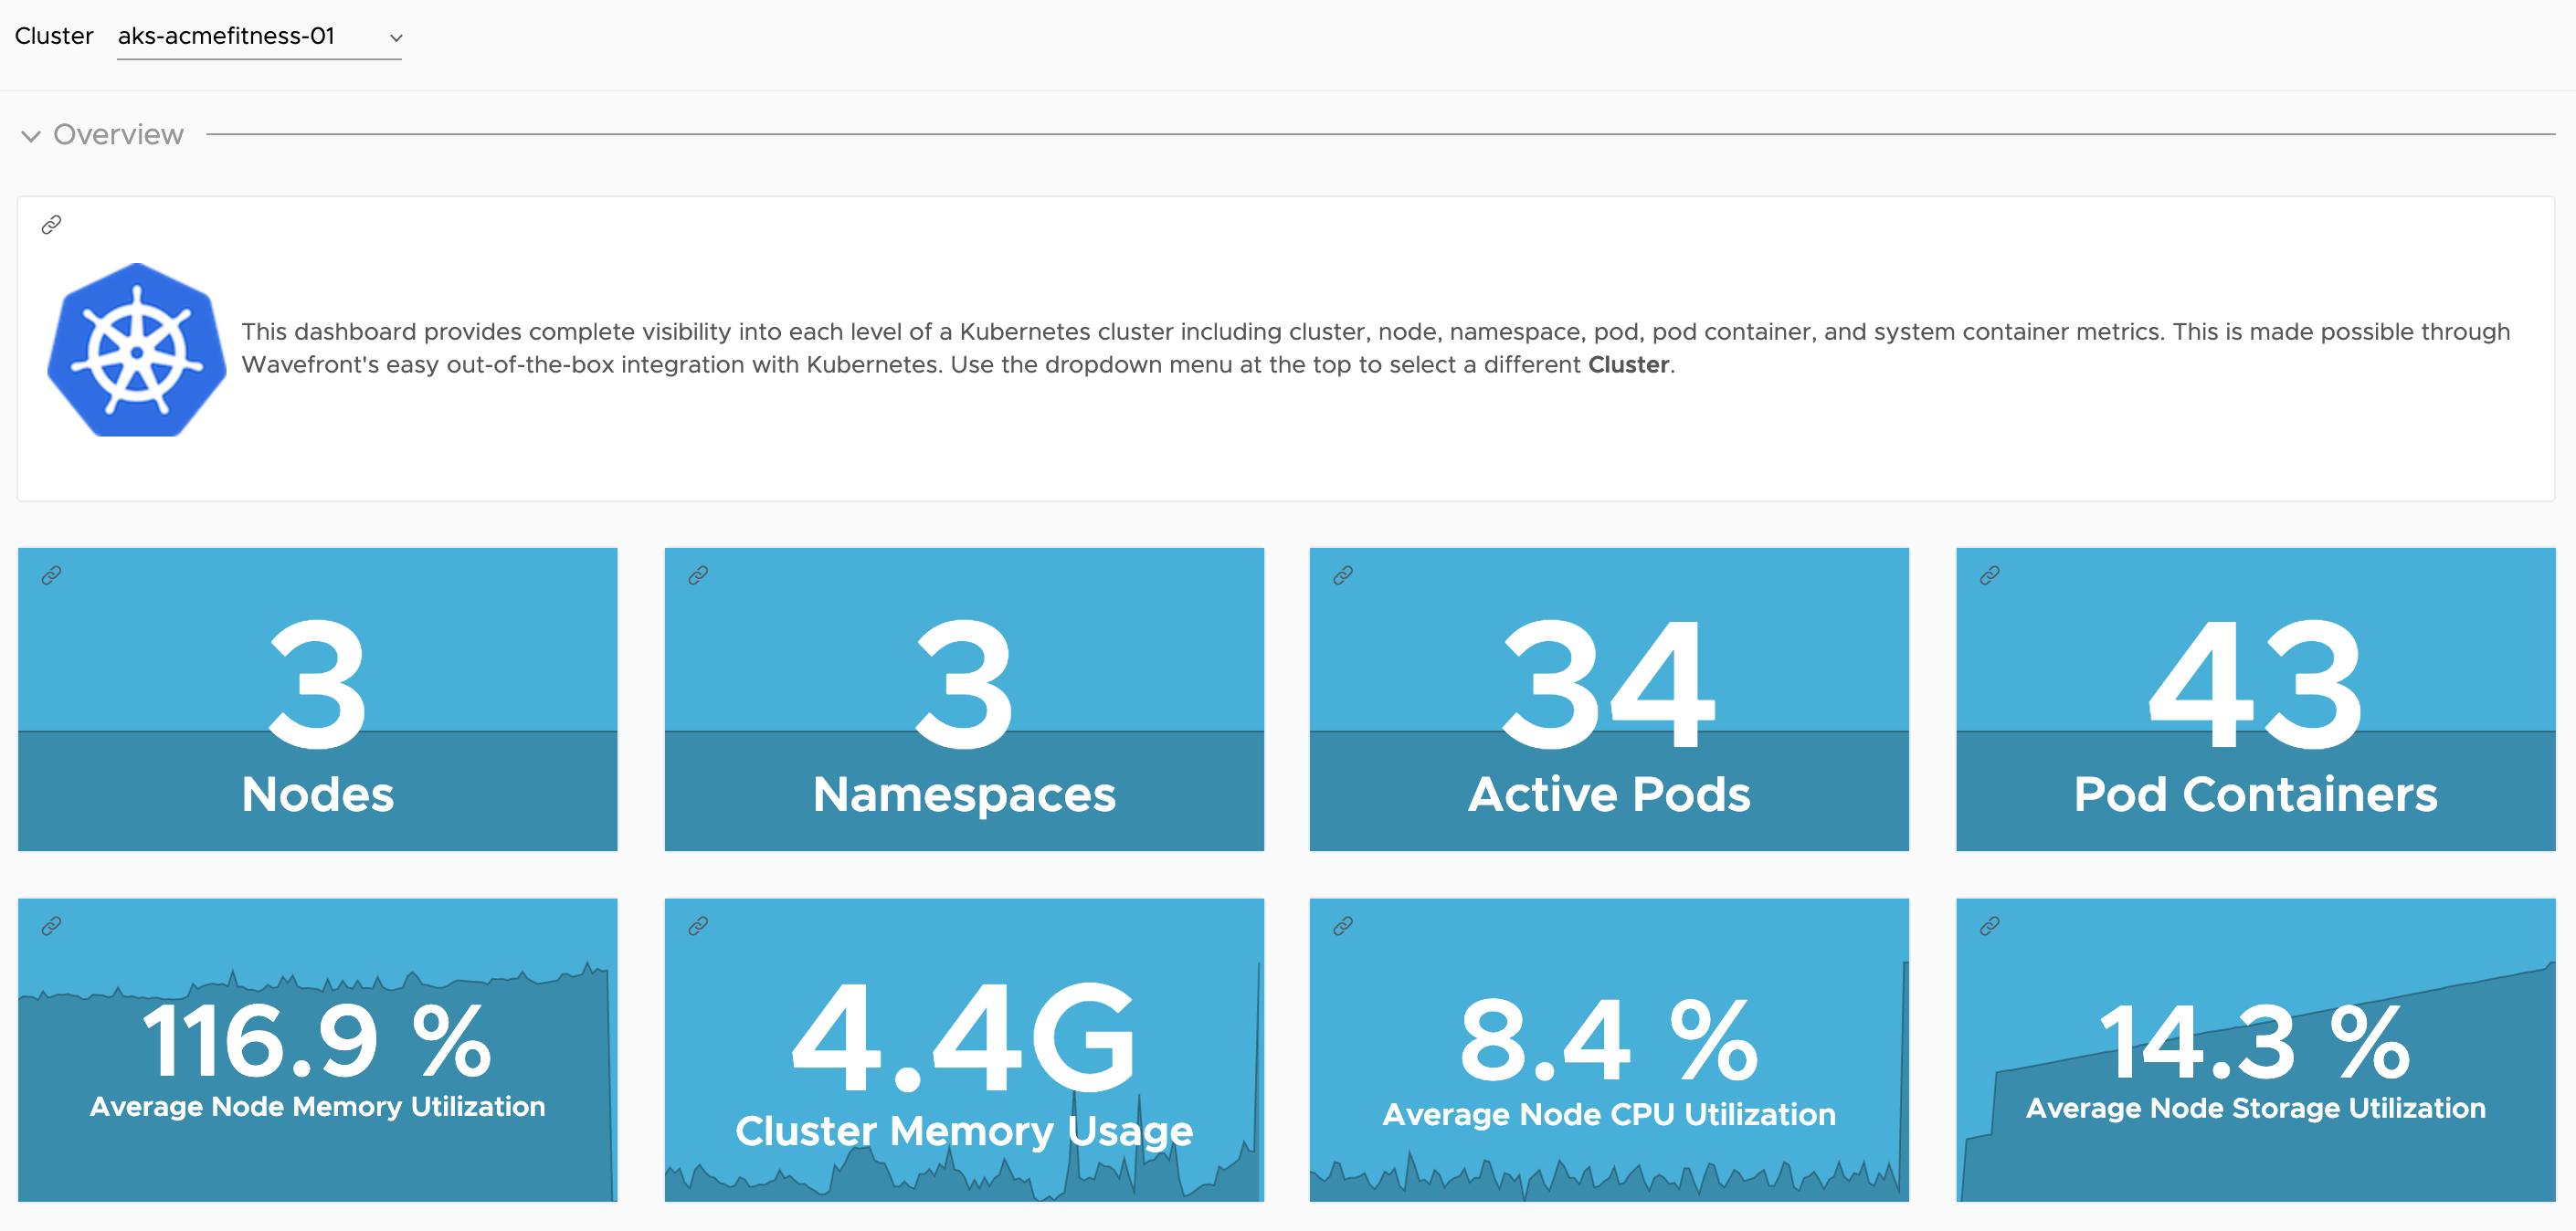
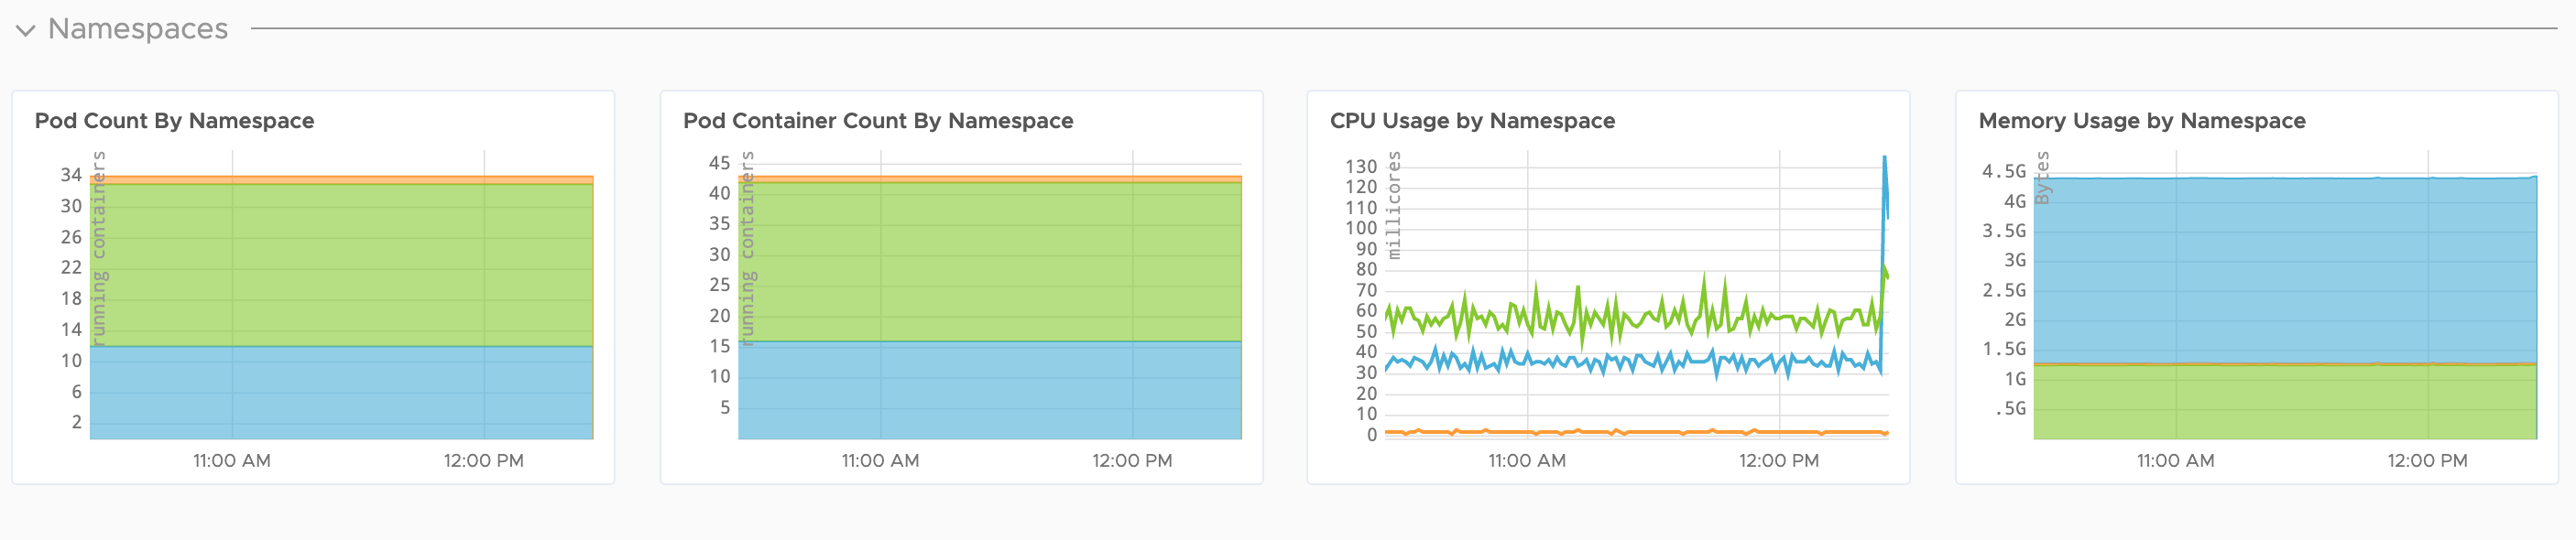
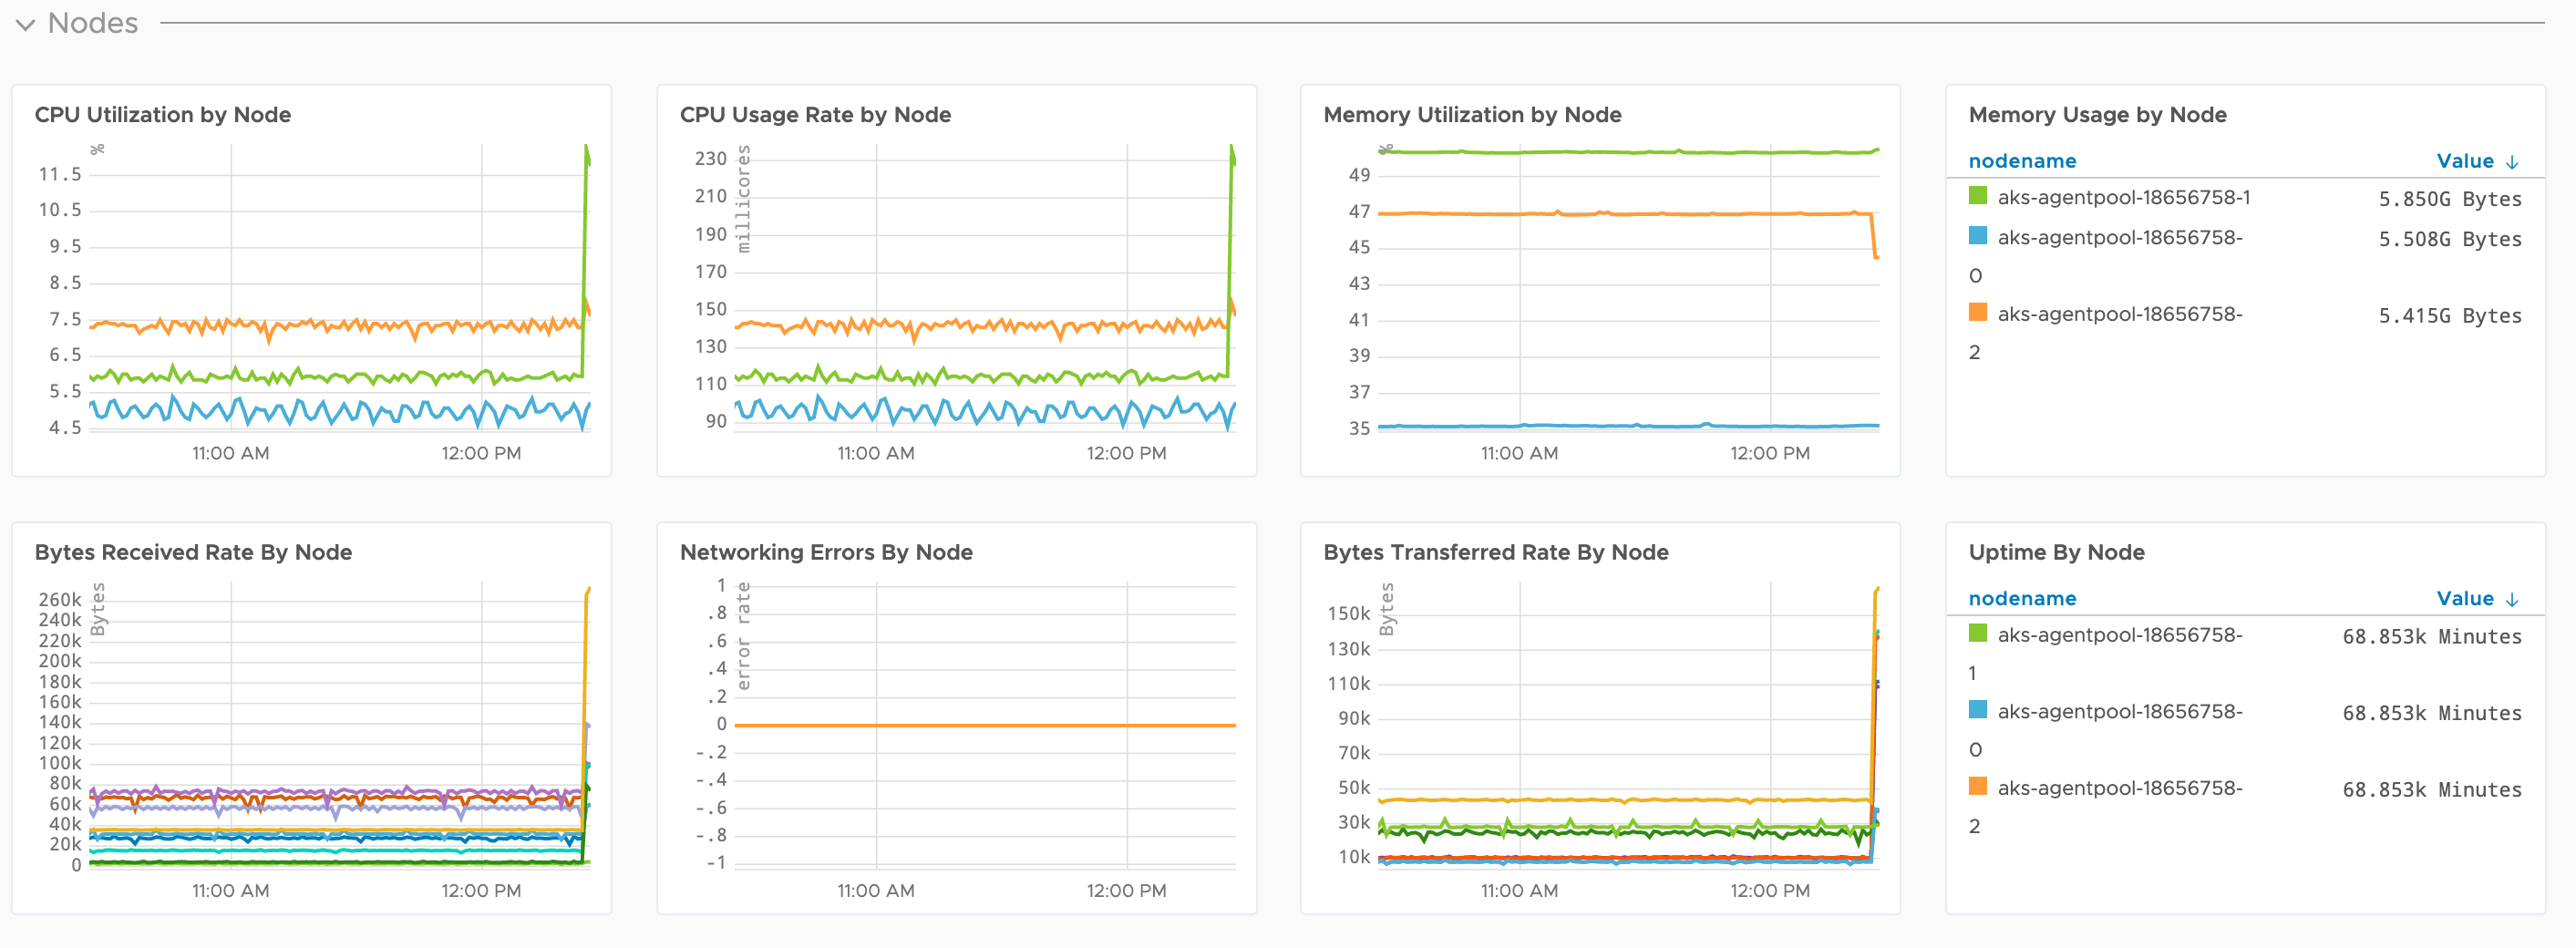
Kubernetes Dashboard
Here are a few screenshots of the base Kubernetes dashboard within Wavefront. While these are not the primary focus for this blog, each of these highlights the depth that Wavefront provides for Kubernetes clusters
Wavefront Service Maps
In a distributed system or microservices-based application, it can seem complex to troubleshoot due to the many requests that are being called in the background. Wavefront Service Map depicts the request call flow across different services. All services that are not involved in a given request, but are called in other requests, are grayed out. This gives you a clear picture of the services involved the request flow. So, you can quickly isolate and focus on the services involved in any request. Furthermore, each service map is customizable, allowing you to drag and arrange service nodes as needed simply.
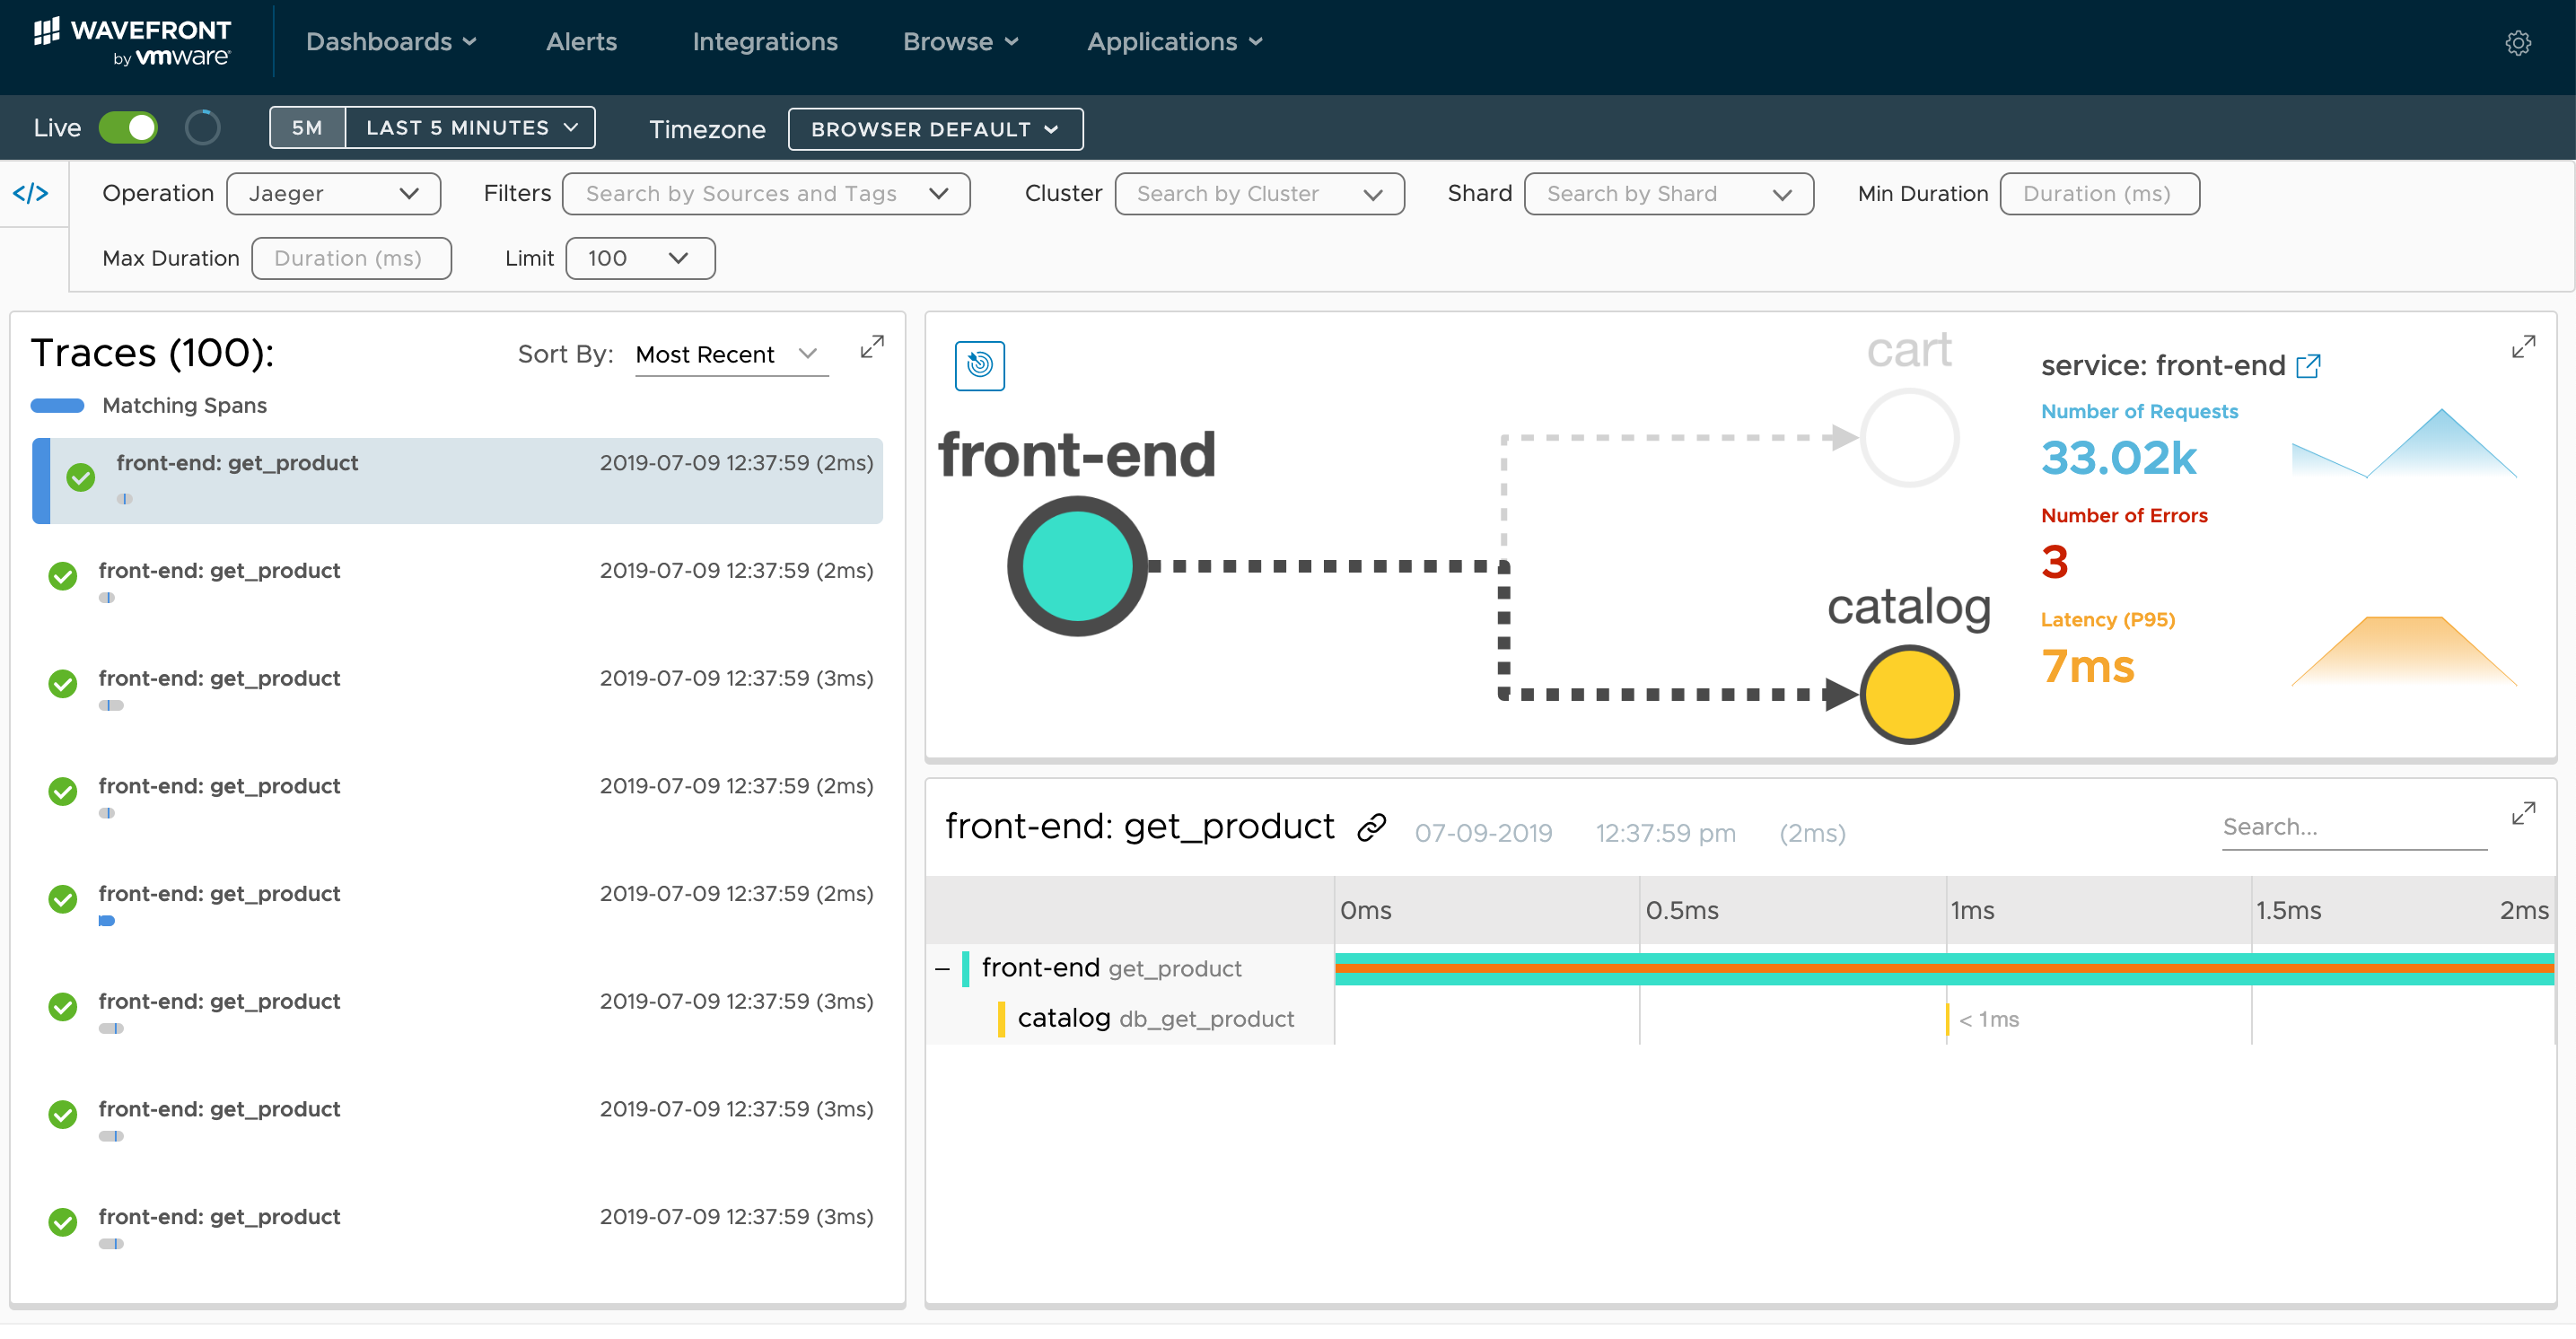
The next screenshot highlights the Visualization of Request Flow and Service Dependencies. Notice the ‘front-end’ service flow to ‘cart’ and ‘catalog’ services along with Number of Requests, Number of Errors and Latency (P95) in this example. Wavefront automatically generates this without any additional configuration.
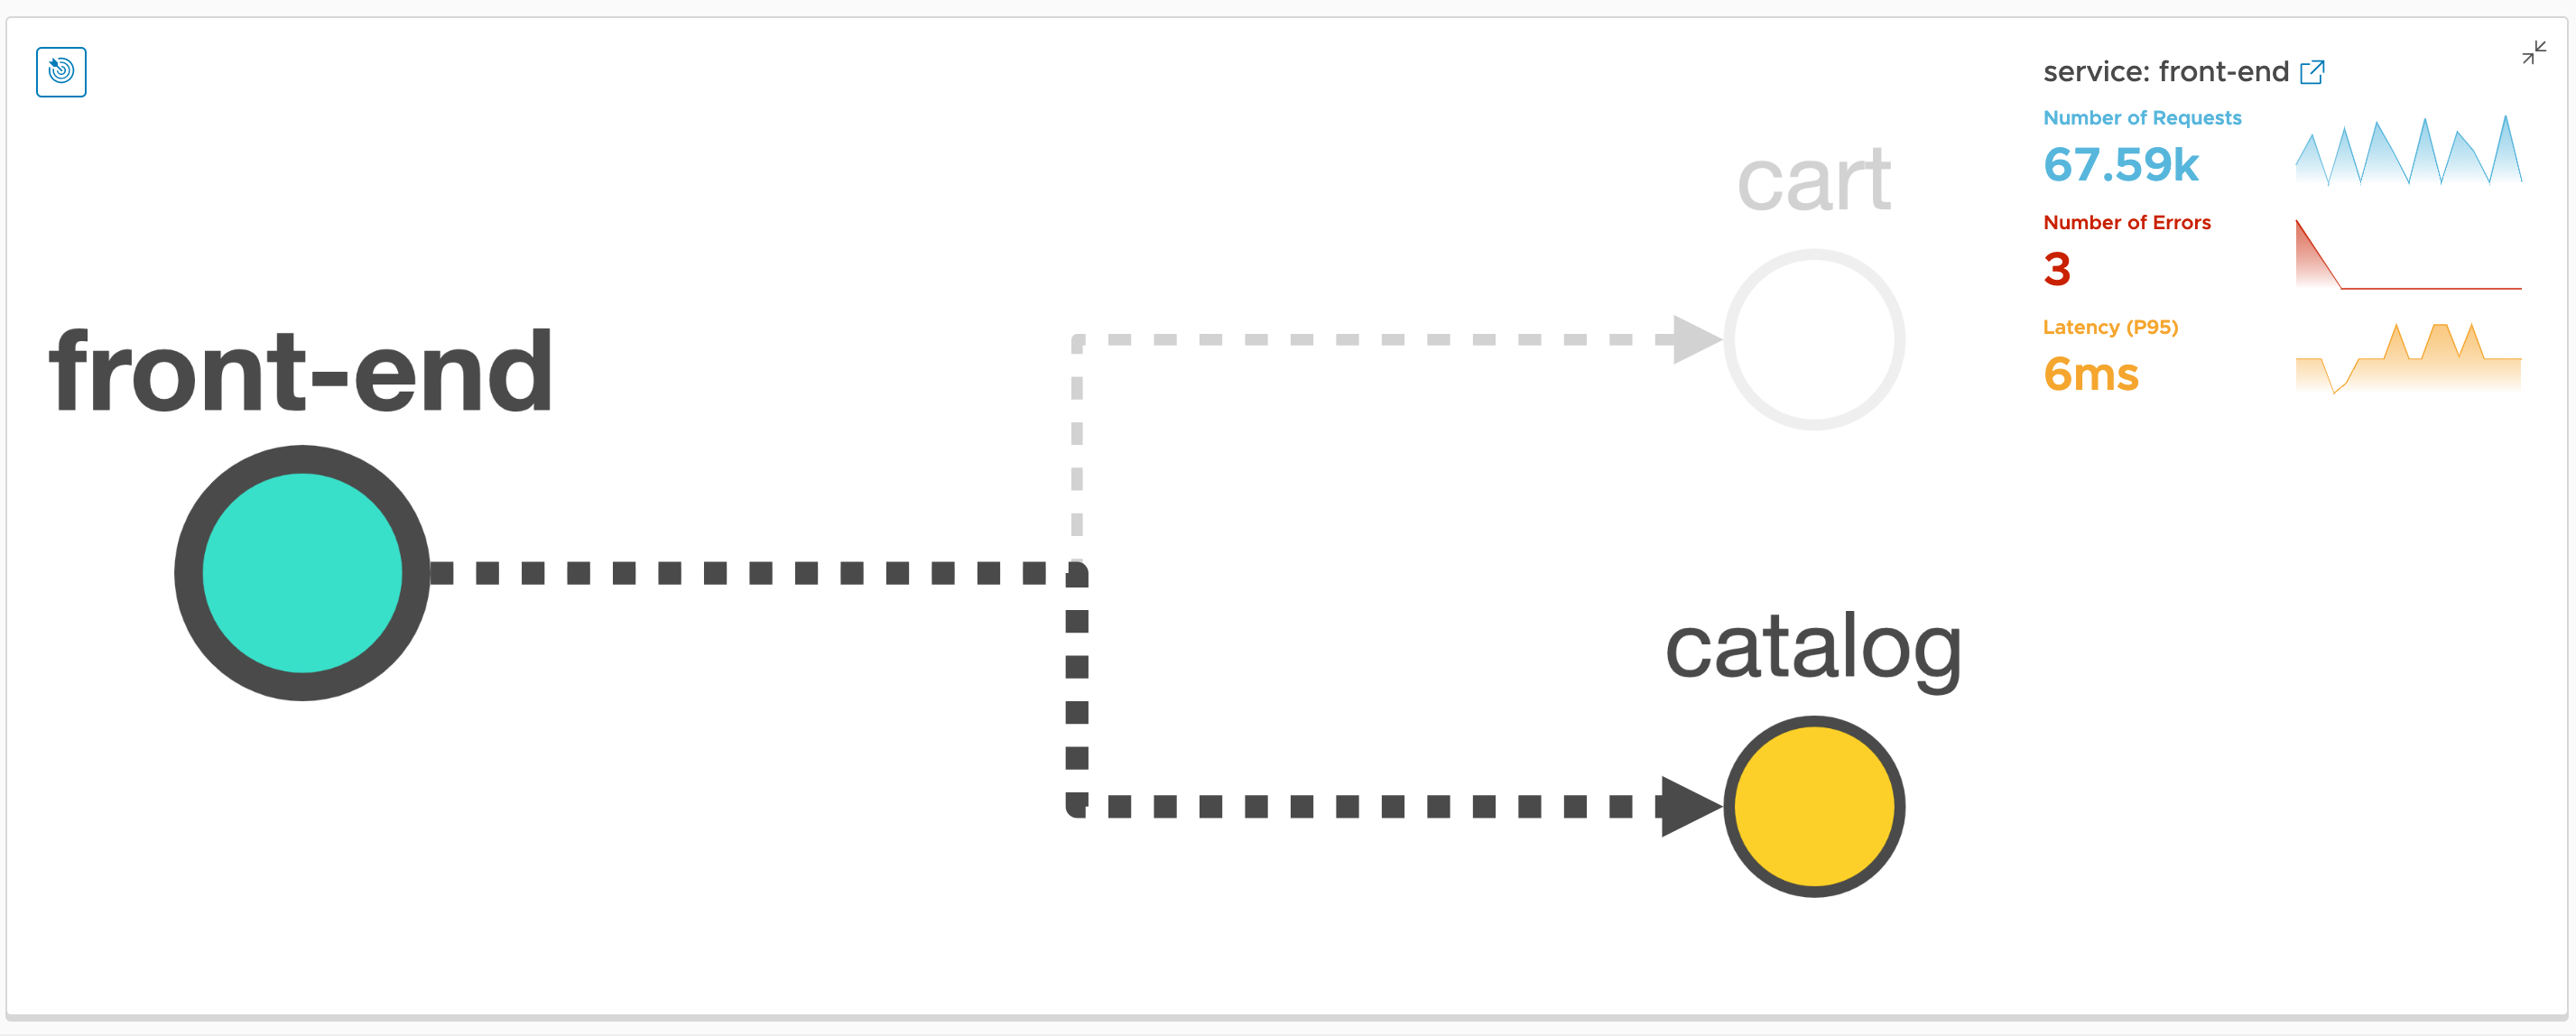
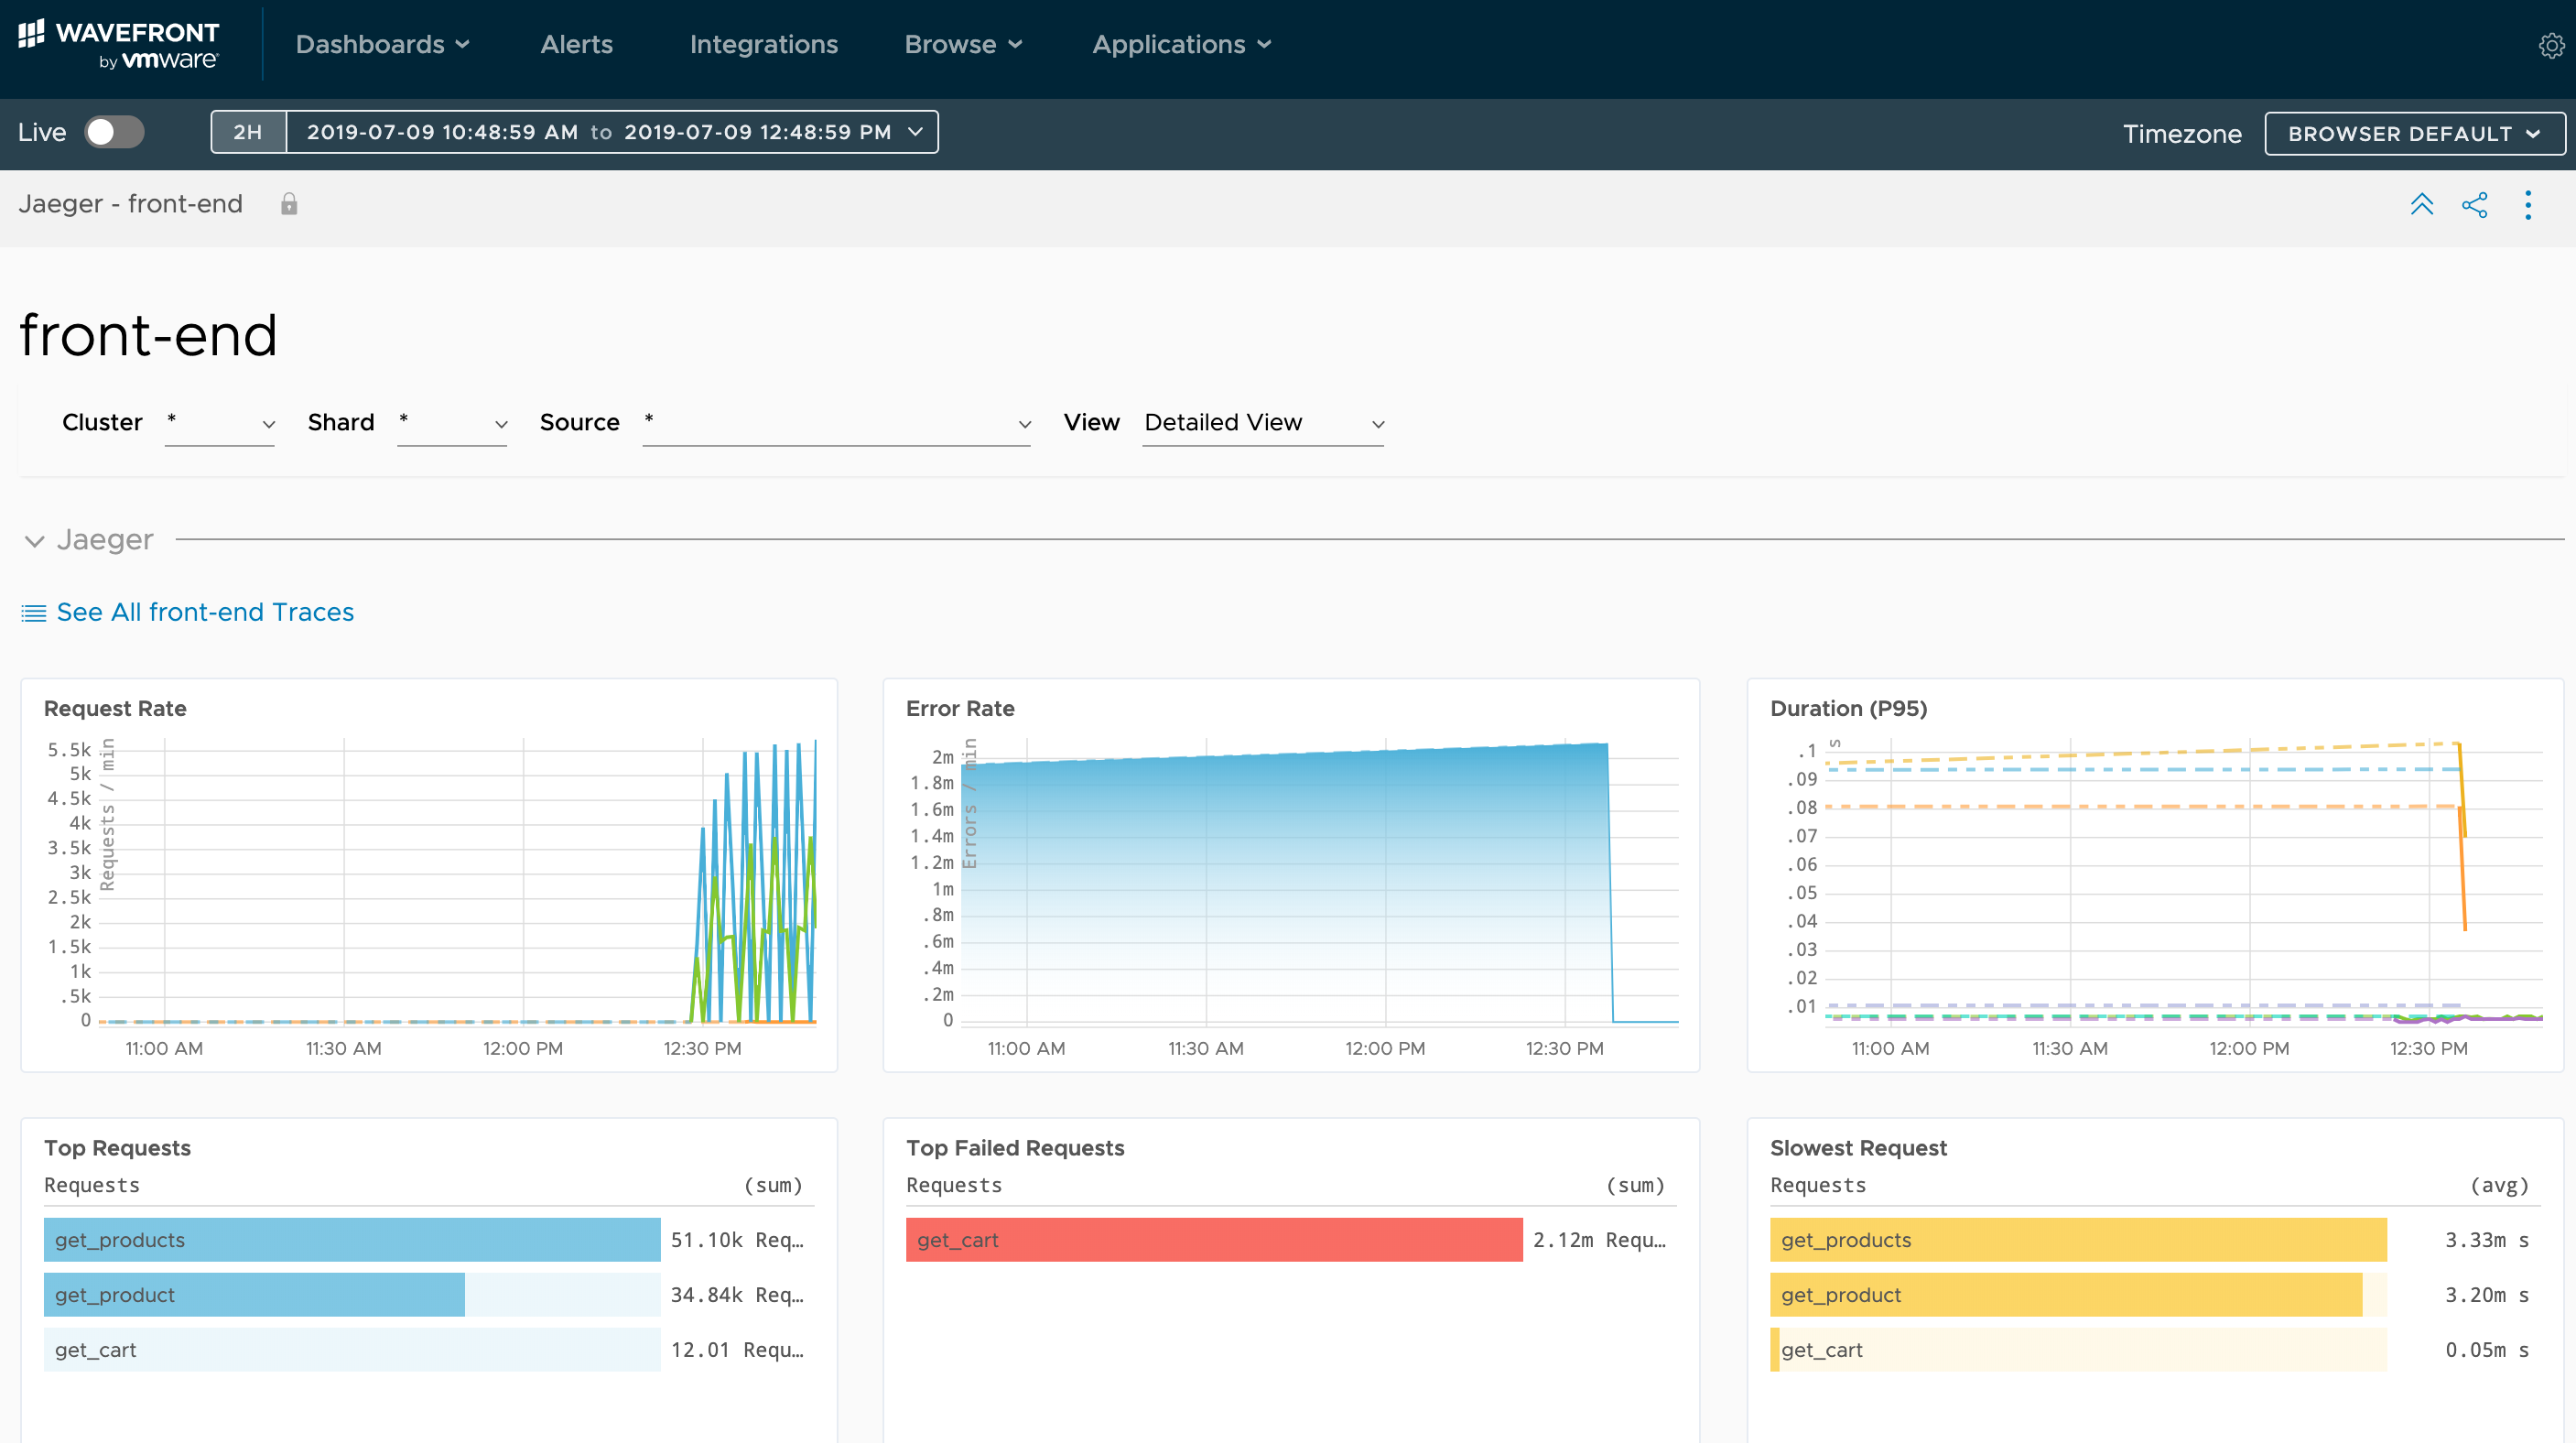
My favorite feature is the health metrics availability for each Service. By launching into the individual service, I can see the Front End Service metrics being generated by Jaeger.
Number of Requests: 65K Number of Errors: 3 Latency (P95): 6ms
This particular service is running pretty well at the moment.
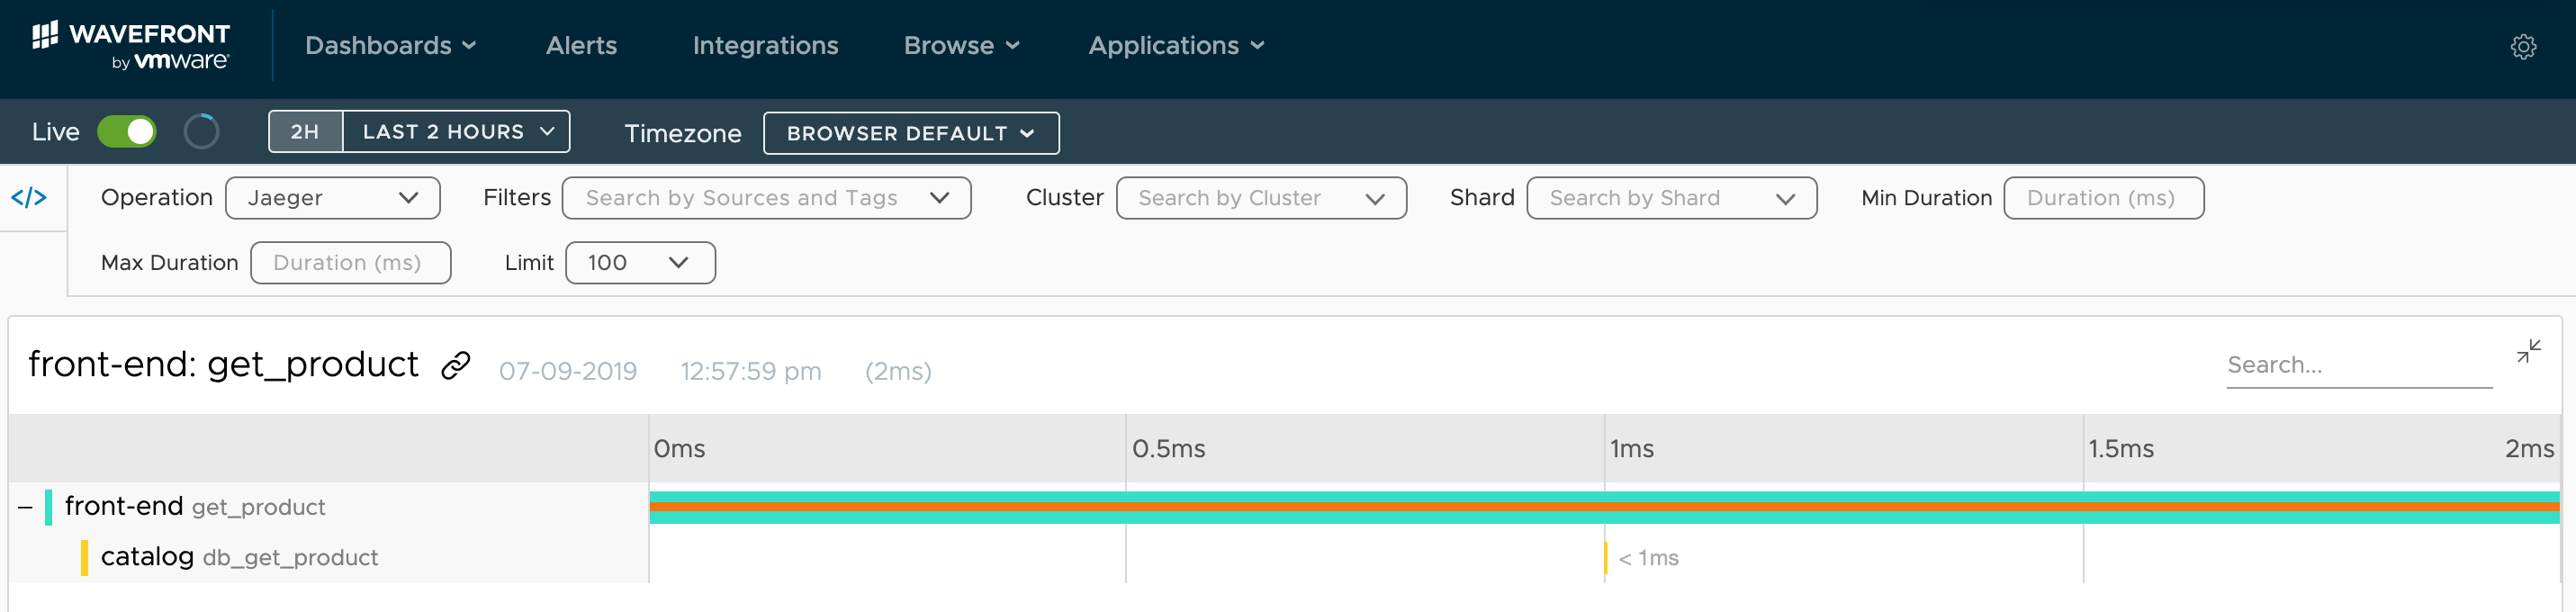
While this example is pretty basic, complexity is possible depending on the size and scale of the application. For that, Wavefront provides a detailed trace view highlighting the path for each trace depending on each service.
This example shows the Front End ‘get-product’ API trace with a call to the Catalog ‘db_get_product’ API.
Observability Matters
Cloud Native applications may seem more complex but the benefits and value driven from them are evident. Tooling helps simplify the troubleshooting aspects.
In this example, AKS provided the infrastructure, Jaeger provided mechanism for distributed tracing and Wavefront was used to bring the traces to life.
The Wavefront team offers a Free 30 day trial and I suggest you give this entire scenario a try.