Application Visibility in AWS with Network Insight
A few weeks after I started a new role, my peer and I decided to swap speaking sessions at VMworld 2018 and suddenly I had not one, but four speaking engagements at VMworld US. This was just my second time attending VMworld, so I wanted to make sure this goes off well. I’ve thought about writing the experience of working behind the scenes leading up to a major conference and what it takes, but we’ll leave that for another day and another Medium entry. Our team has a few more events coming down the road, so be sure to check back in a few months!
Coming back to VMworld US 2018, as Umang Soni — my co-presenter and I discussed how we want to present the session and build demos for it, we decided to try and use real-life customer scenarios we had come across in our interactions and try to showcase them in the session. In this blog, we’ll try to walk through a few of them. If you prefer to watch the session, it is available here: https://videos.vmworld.com/searchsite/2018/videoplayer/19800
If you’re attending VMworld EMEA 2018 in Barcelona, please plan to attend #MGT2844BE AWS App Security and Visibility with Network Insight: Thursday, Nov 8th, 10.30am-11.30am!
The first scenario came up in a meeting we had with the cloud admins where they were in the midst of an all-hands on deck troubleshooting exercise for their core application that had gone down. The gist of the issue was that their DevOps and Security teams were trying to ascertain the application flows and correlate it with AWS Security Groups that had been created. The AWS Security Groups were initially built by the Dev teams to allow access to core services (AD,DNS,NTP etc.), but as they started putting in application specific security rules, the application started to break. So how does Network Insight help with this?
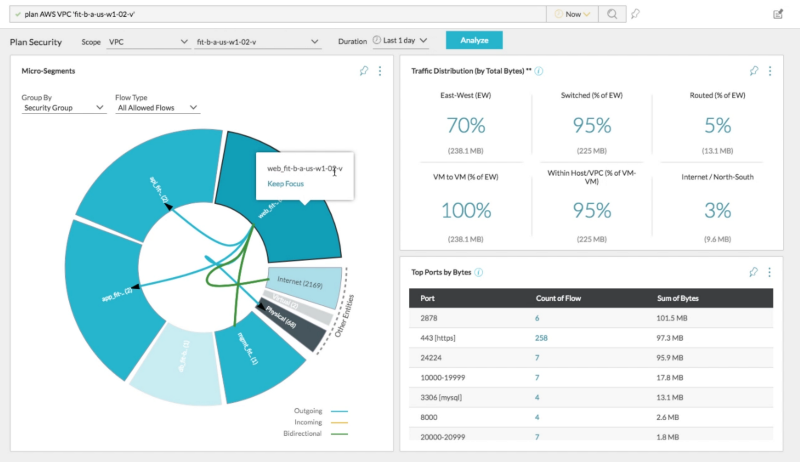
Firstly, the same way Network Insight provides great visualization, analytics and correlation for on-premises resources, it can also do so for AWS VPC’s, AWS Security Groups, VPC flowlogs and providing analysis about how they are communicating with each other. A simple command such as “ plan AWS VPC ” in the search bar or through the UI brings up the below screenshot. Below you can see traffic flows between the “web-tier” security group and the rest of the security groups that are part of the selected VPC.

As we further dissected the application flows, we realized that this application was actually a hybrid application where the DB tier lived on-premises in their vSphere based private cloud environment.
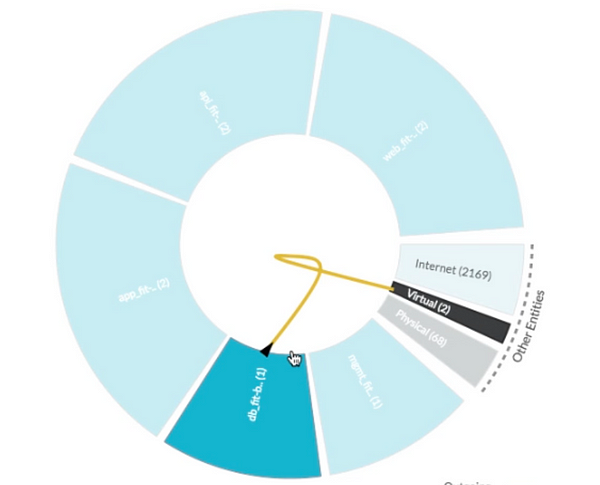
Network Insight was able to classify and identify the two DB VM’s that were part of this and highlight how the DB loadbalancer was communicating with the on-premises VM’s. We’re able to identify and classify these assets as they’ve been added as data-sources to Network Insight.
Next, in order to further drill down into the application, the easiest way was to model the different tiers of the application. This could be done either programmatically using the Network Insight API’s or through the UI. As seen below, there are several parameters one could use to define the application tiers. Here, we are using the AWS tag that is associated with the application itself and then we match on EC2 instances that have a name that starts with webx*. Pretty sweet huh!
Now, that we have the application defined, let’s take a closer look at how the application flows for the individual tiers that we defined. Upon closer examination of the different tiers, we find a new flow in the API tier communicating on port 5000.
If we click on the Recommended Firewall rules tab, it tells us that we should have a firewall rule from the Web-Front End to API-Tier allowing TCP/5000.
Using the natural language search bar on top, we run a search query for AWS Security group <name_of_the_security_group> and it gives us all the parameters such as firewall rules, EC2 instances, traffic flows that match the specified criteria. As we drill down into the different security groups and firewall rules, we quickly realize that the API-tier security group is missing a firewall rule for port 5000 as seen below.
Now that we had the appropriate port information, the teams updated the inbound rule in the AWS console for the appropriate security group and the application came back online. This is a quick and easy example of troubleshooting with Network Insight.
As we were showing the above use case to the customer, they asked — hey is there a way you can show us traffic that is coming from certain countries? We need to ensure that there’s no SSH traffic to any of the instances other than the management EC2 instance.
Using the search bar, we developed a little query that allowed us to quickly find flows from all countries that are destined to the defined application on port 22.
This is a quick search, but also very broad. As you’ll see this brings back a ton of results and is a lot of information to navigate through. In order to filter down to what we really need to focus on, we filter down to Destination VM’s on the left navigation pane. If you want to focus on source countries, that’s an option as well!
Now to make this really interactive and have Network Insight proactively alert the user, we can create a user defined event definition by clicking the bell icon. This allows to create a custom search definition that runs in the background and alerts the user when the search results deviate.
Lastly, I always find it useful to pin as much of these searches as I can. If you’ve ever used Pintrest (my wife swears by it!), this is very similar in concept. You can simply pin these searches from above in a user-friendly board and generate a pinboard. Below you’ll find all the pins in a single board for easy access.
Stay tuned and let me know what you want to see from #NetworkInsight! For more details on the platform, please visit : https://cloud.vmware.com/network-insight