Flask, Django, and mysql stats collection via Telegraf sidecars & Wavefront in a Kubernetes deployment
Kubernetes (K8S), is becoming the defacto management tool to run applications homogeneously across resources (bare metal, public cloud, or private cloud). The single most widely deployed operational component in kubernetes is monitoring.
Almost everyone uses Prometheus in a cluster to aggregate the stats from the cluster. Grafana is then used to graph these stats.
Most articles are written showcasing Prometheus and grafana with a focus on cluster (node, pode, etc) stats. Rarely do any of these discuss application level stats.
While Prometheus has exporters, i.e. mysql (see setup), nginx and even Django, there are alternative mechanisms to export application stats.
How do I simply output stats from the application and then be able to send these stats any aggregation tool?
In this blog, I will explore the use of Telegraf, as a sidecar to extract stats from different application components such as Flask, Django, and mysql.
Telegraf has a wide range of plugins. More than Prometheus’ set of exporters.
Telegraf can send these stats to Prometheus or other locations. In this configuration I will showcase Wavefront.
Wavefront can aggregate all stats from all clusters vs prometheus generally displays stats for the specific cluster its deployed in.
In subsequent blogs, I will explore use of telegraf with Prometheus for application stats.
Application & cluster stats in Wavefront
With the use of telegraf side cars and Wavefront, for flask, django, and mysql pods running in a Kubernetes Cluster, the following output graphs (application and cluster level) are visible in Wavefront
Configuration and creation of the sidecars, and the configurations used is detail in the next few sections
Application stats:
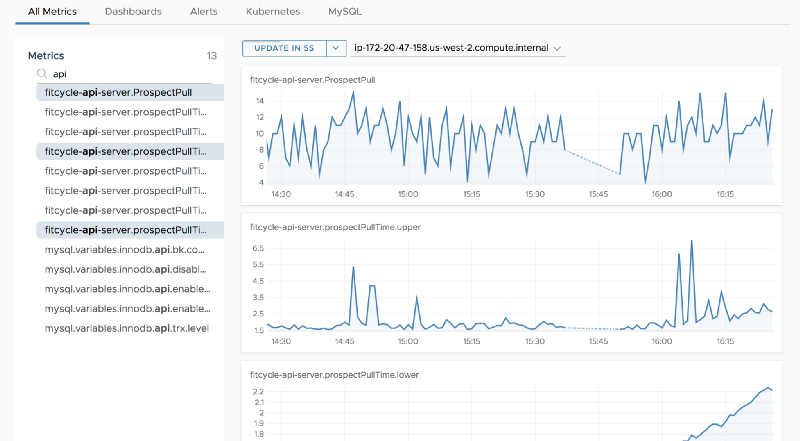
api-server stats (flask based)
flask stats
Stats detailed above are added by the developer for this particular implementation of flask. The two stats on display above are
- API call “timer” per call — this has several metrics such as Timer_stddev, Timer_mean, Timer_upper, etc
- Total number of calls in a given period
These stats are output via statsd and collected via telegraf statsd collector. I will detail how to instrument this later in the blog.
mysql stats
mysql stats
mysql stats are obtained via a pull from mysql directly. Approximately 200+ statsd can be pulled.
These stats are output via telegraf configured as a mysql collector.
web server stats (Django based)
django based application stats
Stats detailed above are added by the developer for this particular implementation of django. The two stats on display above are
- Sign-up “timer” that outputs a few metrics — Timer_stddev, Timer_mean, Timer_upper, etc
- Total number of signups
These stats are output via statsd and collected via telegraf statsd collector. I will detail how to instrument this later in the blog.
Cluster Stats:
In addition to application level stats, the entire cluster level stats can be displayed. This is achieved using heapster (will be changed later), with output to Wavefront.
The following stats are generally shown:
- Namespaces level stats
- Node level stats
- Pod level stats
- Pod container stats
The following sample output graphs show the standard Kubernetes dashboard in Wavefront.
Sample Application (called Fitcycle)
In order to walk through the configuration, I built an application with statsd output (stdout) and deployed it in kubernetes.
The sample app is called fitcycle and is located here:
https://github.com/bshetti/container-fitcycle
You can run this in any K8S platform (GKE, EKS, etc). I specifically ran it in VMware Cloud PKS (formerly VMware Kubernetes Engine (VKE)). Once deployed the app has the following services available:
- Main webpage and form page for fitcycle is served by a Django server (supported by web-server PODs)
- API is served by a Flask based server (api-server PODs)
- mysql server is served by the mysql POD
- In VMware Kubernetes Engine — it provided a preloaded nginx ingress controller which uses a URL based routing rule to load balance between the api-server and web-server (not shown in the diagram below)
fitcycle application
The application outputs the following metrics:
- api-server (flask), and the web-server (Django)output statsd to port 8125 in each pod (internally)
- mysql collects metrics can be accessed logging in and polling for the right tables.
How are stats collected and exposed?
Creating a statsd collector using telegraf
Telegraf not only has a wide variety of inputs/outputs vs prometheus, it can also output data to prometheus. In deploying telegraf for the fitcycle application, I created a statsd container with the following configuration:
- statsd input plugin polling port 8125 against the main container in the pod for the api-server pod and web-server pod. FULL LIST of Telegraf inputs
- wavefront output plugin to send the output to the Wavefront proxy service running in the cluster. FULL LIST of Telegraf outputs
(I’ll write another blog about using telegraf with Prometheus)
Detailed repo for building the container is located here:
https://github.com/bshetti/telegraf-wavefront
The container uses the alpine version of telegraf but changes the standard telegraf.conf file with the following:
telegraf.conf
    # Global tags can be specified here in key="value" format.
    [global_tags]
      pod_name = "$POD_NAME"

    # Configuration for telegraf agent
    [agent]
      ## Default data collection interval for all inputs
      interval = "$INTERVAL"
      ## Rounds collection interval to 'interval'
      ## ie, if interval="10s" then always collect on :00, :10, :20, etc.
      round_interval = true

    ## Telegraf will send metrics to outputs in batches of at
      ## most metric_batch_size metrics.
      metric_batch_size = 1000
      ## For failed writes, telegraf will cache metric_buffer_limit metrics for each
      ## output, and will flush this buffer on a successful write. Oldest metrics
      ## are dropped first when this buffer fills.
      metric_buffer_limit = 10000

    ## Collection jitter is used to jitter the collection by a random amount.
      ## Each plugin will sleep for a random time within jitter before collecting.
      ## This can be used to avoid many plugins querying things like sysfs at the
      ## same time, which can have a measurable effect on the system.
      collection_jitter = "0s"

    ## Default flushing interval for all outputs. You shouldn't set this below
      ## interval. Maximum flush_interval will be flush_interval + flush_jitter
      flush_interval = "$INTERVAL"
      ## Jitter the flush interval by a random amount. This is primarily to avoid
      ## large write spikes for users running a large number of telegraf instances.
      ## ie, a jitter of 5s and interval 10s means flushes will happen every 10-15s
      flush_jitter = "0s"

    ## By default, precision will be set to the same timestamp order as the
      ## collection interval, with the maximum being 1s.
      ## Precision will NOT be used for service inputs, such as logparser and statsd.
      ## Valid values are "Nns", "Nus" (or "Nµs"), "Nms", "Ns".
      precision = ""
      ## Run telegraf in debug mode
      debug = false
      ## Run telegraf in quiet mode
      quiet = false
      ## Override default hostname, if empty use os.Hostname()
      hostname = "$NODE_HOSTNAME"
      ## If set to true, do no set the "host" tag in the telegraf agent.
      omit_hostname = false

    # Statsd Server
    [[inputs.statsd]]
      ## Protocol, must be "tcp", "udp4", "udp6" or "udp" (default=udp)
      protocol = "udp"

    ## MaxTCPConnection - applicable when protocol is set to tcp (default=250)
      max_tcp_connections = 250

    ## Enable TCP keep alive probes (default=false)
      tcp_keep_alive = false

    ## Specifies the keep-alive period for an active network connection.
      ## Only applies to TCP sockets and will be ignored if tcp_keep_alive is false.
      ## Defaults to the OS configuration.
      # tcp_keep_alive_period = "2h"

    ## Address and port to host UDP listener on
      service_address = ":8125"

    ## The following configuration options control when telegraf clears it's cache
      ## of previous values. If set to false, then telegraf will only clear it's
      ## cache when the daemon is restarted.
      ## Reset gauges every interval (default=true)
      delete_gauges = true
      ## Reset counters every interval (default=true)
      delete_counters = true
      ## Reset sets every interval (default=true)
      delete_sets = true
      ## Reset timings & histograms every interval (default=true)
      delete_timings = true

    ## Percentiles to calculate for timing & histogram stats
      percentiles = [90]

    ## separator to use between elements of a statsd metric
      metric_separator = "_"

    ## Parses tags in the datadog statsd format
      ##
          parse_data_dog_tags = false

    ## Statsd data translation templates, more info can be read here:
      ##
      # templates = [
      #     "cpu.* measurement*"
      # ]

    ## Number of UDP messages allowed to queue up, once filled,
      ## the statsd server will start dropping packets
      allowed_pending_messages = 10000

    ## Number of timing/histogram values to track per-measurement in the
      ## calculation of percentiles. Raising this limit increases the accuracy
      ## of percentiles but also increases the memory usage and cpu time.
      percentile_limit = 1000

      # Specify optional tags to be applied to all metrics for this plugin
      # NOTE: Order matters, this needs to be at the end of the plugin definition
      # [[inputs.statsd.tags]]
        # tag1 = "foo"
        # tag2 = "bar"

    # Configuration for Wavefront proxy to send metrics to
    [[outputs.wavefront]]
      host = "$WAVEFRONT_PROXY"
      port = 2878
      metric_separator = "."
      source_override = ["hostname", "nodename"]
      convert_paths = true
      use_regex = false
As noted in bold above two plugins are configured for telegraf:
- input section — for statsd
- output section — for wavefront (this can be replaced with prometheus)
There are several ENV variables in BOLD above that are important to note:
- $POD_NAME — used to note the name of the pod if you want to particularly distinguish the pod (I will pass this in when using the container in Kubernetes as a sidecar)
- $NODE_HOSTNAME — used to note the node where the pod is running (I will get this via a global spec variable from kubernetes when creating the sidecar container)
- $INTERVAL — to note the collection interval time
- $WAVEFRONT_PROXY — this is the kubernetes service name, DNS or IP of the wavefront proxy
This telegraf.conf is used in the Dockerfile to create the container
Dockerfile
    # Telegraf agent configured for Wavefront output intended to be used in a sidecar config

    FROM telegraf:alpine

    ENV WAVEFRONT_PROXY="wavefront-proxy"
    ENV INTERVAL="60s"

    COPY telegraf.conf /etc/telegraf/telegraf.conf

    CMD ["telegraf", "--config", "/etc/telegraf/telegraf.conf", "--config-directory", "/etc/telegraf/telegraf.d"]
Now simply run:
docker build -t telegraf-statsd .
And save the container to your favorite repo.
My version of the telgraf based statsd container is available via google registry.
gcr.io/learning-containers-187204/telegraf-statsd-sc
Kubernetes configuration using Telegraf-statsd container
Now that the statsd collector container is built and saved, I added it in a several kubernetes deployment yaml files.
I’ll walk through the api-server (flask server) kubernetes deployment file showing how to configure the statsd collector as a side car. The Django and mysql configurations are similar, and details are found in my git repo.
https://github.com/bshetti/container-fitcycle/tree/master/wavefront
Here is the deployment yaml for the api-server
apiVersion: apps/v1beta1 # for versions before 1.8.0 use apps/v1beta1
kind: Deployment
metadata:
  name: api-server
  labels:
    app: fitcycle
spec:
  selector:
    matchLabels:
      app: fitcycle
      tier: api
  strategy:
    type: Recreate
  replicas: 3
  template:
    metadata:
      labels:
        app: fitcycle
        tier: api
    spec:
      volumes:
      - name: "fitcycle-apiserver-data"
        emptyDir: {}
      containers:
      - image: gcr.io/learning-containers-187204/api-server-ml:latest
        name: api-server
        env:
        - name: MYSQL_ID
          value: "root"
        - name: MYSQL_PASSWORD
          valueFrom:
            secretKeyRef:
              name: mysql-pass
              key: password
        - name: MYSQL_SERVER
          value: fitcycle-mysql
        ports:
        - containerPort: 5000
          name: api-server
        volumeMounts:
        - mountPath: "/data"
          name: "fitcycle-apiserver-data"
        resources:
          requests:
            memory: "64Mi"
            cpu: "100m"
          limits:
            memory: "256Mi"
            cpu: "500m"
- image: gcr.io/learning-containers-187204/telegraf-statsd-sc:latest
        name: telegraf-statsd
        ports:
        - name: udp-statsd
          containerPort: 8125
          protocol: UDP
        - name: udp-8092
          containerPort: 8092
        - name: tcp-8094
          containerPort: 8094
        env:
        - name: WAVEFRONT_PROXY
          value: wavefront-proxy
        - name: INTERVAL
          value: 60s
        - name: METRIC_SOURCE_NAME
          # This can be change to use the Deployment / Statefulset name instead as a simple value
          # The metric source name should not be an ephemeral value
          valueFrom:
            fieldRef:
              fieldPath: spec.nodeName
        - name: POD_NAME
          valueFrom:
            fieldRef:
              fieldPath: metadata.name
        - name: NAMESPACE
          valueFrom:
            fieldRef:
              fieldPath: metadata.namespace
        - name: NODE_HOSTNAME
          valueFrom:
            fieldRef:
              fieldPath: spec.nodeName
        resources:
          requests:
            memory: 30Mi
            cpu: 100m
          limits:
            memory: 50Mi
            cpu: 200m
Note the sections in bold. Key items to note in the configuration are:
- Use the pre-built statsd collector container:
gcr.io/learning-containers-187204/telegraf-statsd-sc:latest
- NODE_HOSTNAME variable uses a value from Kubernetes
- name: NODE_HOSTNAME
          valueFrom:
            fieldRef:
              fieldPath: spec.nodeName
spec.nodeName will return the node name this deployment is being deployed in.
- Collection INTERVAL set to 60s for Wavefront
- WAVEFRONT_PROXY is set to the service name of Wavefront proxy running in the kubernetes cluster. Installation Notes Here.
- Enabling port 8125 — which will listen to the output from the api-server
In order to run:
kubectl create -f api-server-deployment.yaml
Follow the instructions in the github repo for django and mysql configurations
Sample Application (Fitcycle) with Telegraf sidecars
Now that I have deployed the sidecars, we need to also
- deloy the Wavefront proxy (see instructions in the github repo)
- deploy the Wavefront heapster deployment
the application with sidecars now looks like follows:
App (Fitcycle) with Telegraf sidecars
Output in Wavefront is in the beginning of the blog.
For more information on Telegraf, Wavefront, and VMware Cloud PKS
Telegraf
https://www.influxdata.com/time-series-platform/telegraf/
Wavefront
VMware Cloud PKS
https://cloud.vmware.com/vmware-cloud-pks